
There remain many mysteries in the universe such as the last explosion of stars or black holes. X-rays and other types electromagnetic waves with hidden keys for solving these mysteries are flowing around the earth. From the dark recesses of the earth, important information regarding earthquakes and changes in gravity are also sent to us. Recent progress in the science and development of new measuring methods make it possible to obtain new knowledge from this information. Statistical information processing plays an important role in this field as well.
§1 Image processing through information criterion
By composing images (*1) through processing the data of a radio interferometer (*2) (comprised of multiple parabola antennas(*3)) and by analyzing the Doppler effect of radio waves radiated from carbon monoxide, the existence of gas revolving(*4) in far outer space can be confirmed. We are seeing a protoplanetary-system disk.
To extend such observations to areas with shorter wavelengths, we have to correct the disturbance of data caused by the fluctuation of water vapor on the radio wave path.
For this purpose, an "atmospheric fluctuation(*5) model" has also been developed.
"CLEAN" is a method to obtain images. Assume a true radio source intensity distribution, and some configuration of interferometer parabola antennas. (A)
An "out-of-focus" image like (B) by a naive processing of data obtained from this set up. The CLEAN method is used to obtain a clear image by successively processing the out-of-focus image.
As the processing through the CLEAN method progresses, the clear image obtained gradually approaches the original out-of-focus image,
and finally the image returns to the original image. As one of the results of joint research,
a statistical rule to stop the processing at the most appropriate point has been obtained.
(C) → (D) → (E) → (F)
The clear image obtained approaches the original out-of-focus image gradually, and finally the image returns to the original image like (G).
The best result selected for this example is (E).

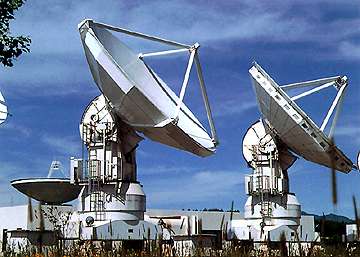
Photo by National Astronomical Observatory
This is the radio interferometer at Nobeyama Radio Observatory of National Astronomical Observatory, which captures radio waves from outer space.
The target of the observation is, for example, radio waves radiated from the remains of the explosion of a supernova at Cassiopeia.
To obtain an image, data processing by computer is necessary.
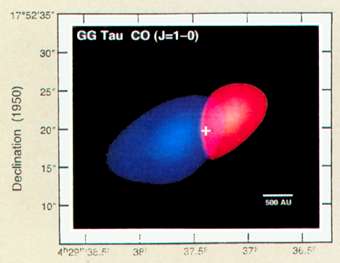
Photo by Mr. Koichiro Morita,
National Astronomical Observatory
Red represents the distribution of gas going away from the earth, and blue represents the distribution of gas approaching the earth.

§2 Making inferences regarding earth's structure
Photo by Prof. Yoshio Fukao,
Earthquake Research Institute, Tokyo University
We can "look" inside the earth with the same fundamental principle as the human X-ray tomography. The statistical model and optimization method are useful for seismic tomography, which utilizes seismic waves instead of X-rays, determines the velocity of seismic waves and speculates on the earth's structure.
§3 Detecting the effects of earthquakes
In the Tokai Area, the change in the ground water has been monitored continuously.Observed data are undergoing intricate changes under the influence of various factors.
Thanks to the innovative time series models, such effects as atmospheric pressure, earth tide, and precipitation can be estimated separately. As a result, the effects of earthquakes can be accurately detected.
(Joint research with the Geological Survey of Japan)
Observation well of the Geological Survey of Japan [observational data]
§4 Detecting the effects of earthquakes
Data by the National Research Institute for Earth Science
and Disaster Prevention.
The frequency of occurrence of a magnitude M earthquake increases exponentially as the earthquake becomes smaller. In fact, it is proportional to 10-bM, and the value of this coefficient b depends on location. The image shows the three-dimensional distribution of the value b, which was determined by an objective Bayesian smoothing based on ABIC applied directly to the data of micro-earthquakes underneath the Kanto Region up to 100km in depth. As the coefficient b increases, the color changes from cold to warm.