-
1. Among Strong Points of the Japanese ‘Polite' ‘Kind' Rank Highest Ever
Open or CloseWhen individuals were asked to select strong points of the Japanese from among 10 specific traits, over 70% responded citing ‘Diligent' ‘Polite' and ‘Kind' (#9.1). Two traits that especially showed an increase of close to 20 points were ‘Polite,' which rose to 77% in 2013 despite being around 50% up to that point, and ‘Kind,' which rose to 71% from its previous rank between 30-50%, marking both at an all-time high. Additionally, ‘Diligent' increased to 77% from its previous rank of around 70%, also marking its all-time high.
The results of the 4-level ranking for the ‘Emotional Richness' of Japan were low from 1993 to 1998 in the percentage of people who answered ‘Very Good' or ‘Somewhat Good' going from 41%, breaking past 30%, to sink to 26% in conjunction with other evaluative items of Japan centered on economic matters (#9.12e). However, this made a quick recovery to 47% in 2013, marking the highest percentage since the survey of this item began in 1973.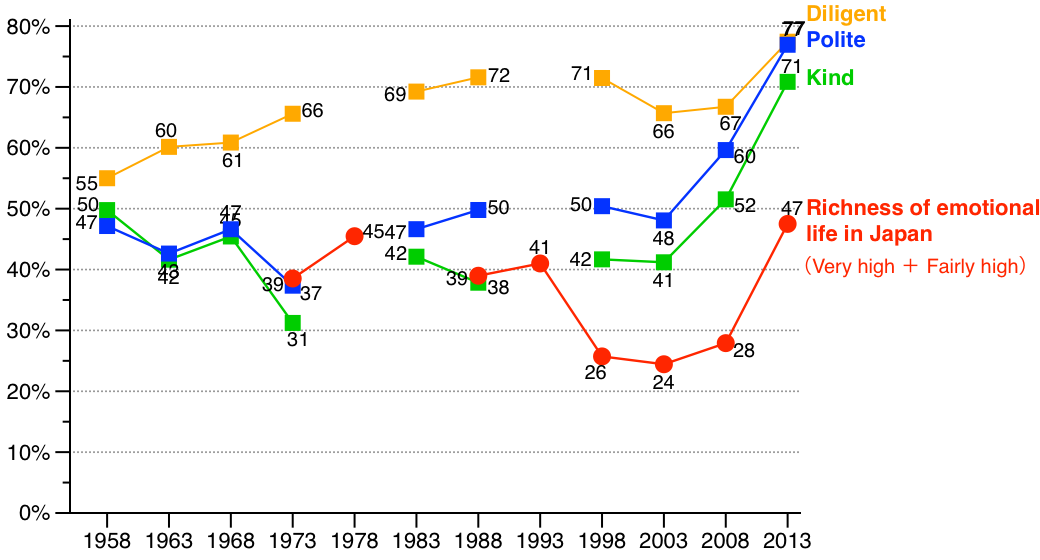
Figure 1. Appraisal of the Japanese Personality (Strong Points) and `Emotional Richness' of Japan
In regards to an item related to the above, when individuals were asked if most people ‘Try to be helpful for others' or ‘Only think of themselves', no more than 19% answered in 1978 that people ‘Try to be helpful for others.' However, this percentage gradually rose with each survey installment, rising nearly 10 points from 36% in 2008 to 45% in 2013, surpassing ‘Only think of themselves' (42%) for the first time (#2.12).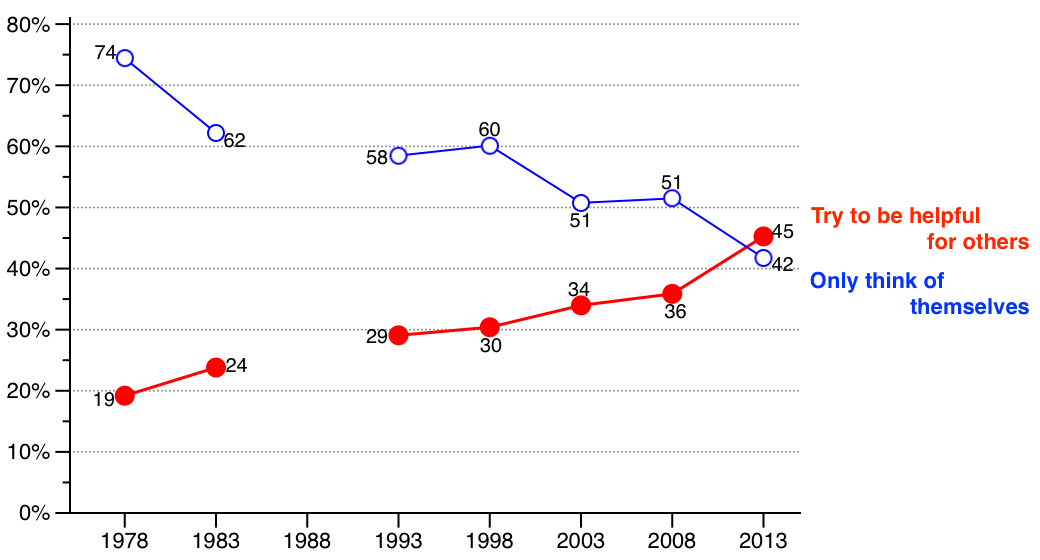
Figure 2. Do most people try to be helpful for others? Or do they only think of themselves?
-
2. If You Could be Born Again, Would You Choose 'Japan'?
Open or CloseWhen individuals were asked if they would 'Like to be born in Japan' or 'Like to be born in another country' if they could have a chance, there was an overall rise in individuals who selected 'Japan' from 77% in 2008 to 83% in 2013 (#9.22c). Examining these results by gender and age group, the percentage of elderly people surpassed 80% in 2008, and the percentage of all age groups, including youth, exceeded 70% in 2013.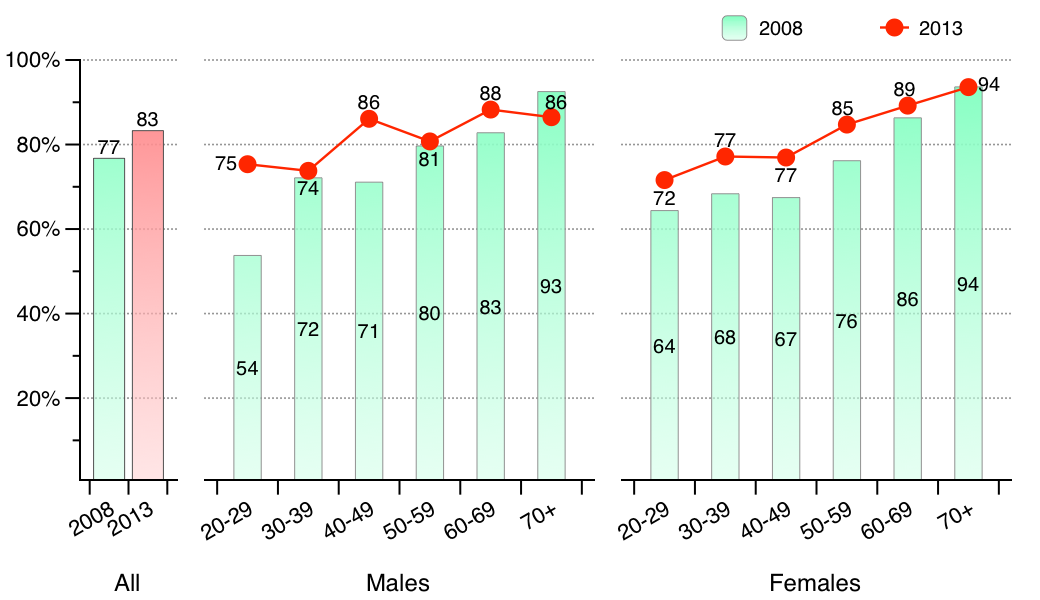
Figure 3. If You Could be Reborn, Would You Like to be Born in Japan?
One of the factors making Japan popular is believed to be the high appraisal of Japanese people themselves, as presented above. Those who actually thought well of Japan's 'Emotional Richness' also wanted 'to be born in Japan' if they could be reborn. We shall omit a detailed graph of this trend; however, this is the same regardless of gender or age group.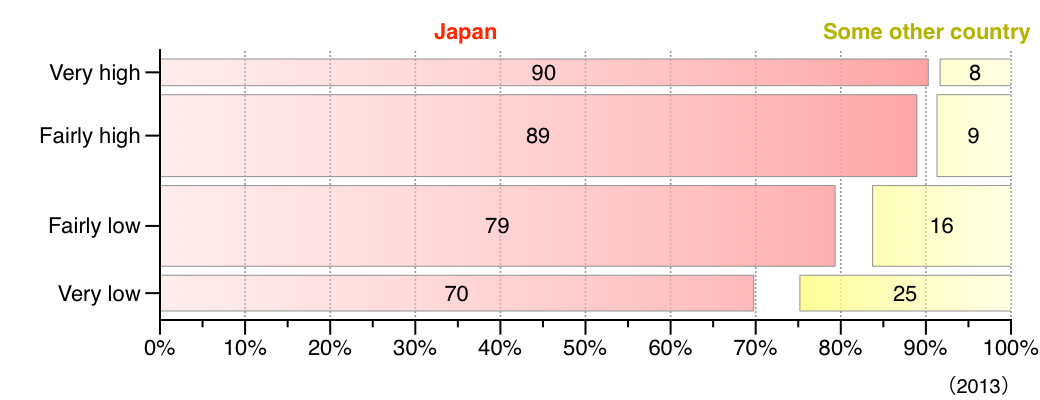
Figure 4. Appraisal of 'Emotional Richness' of Japan and Country One Would Like to be Born in
-
3. Standard of Living – My Lifestyle "Hasn't Changed" is Highest Level even in Reappraisal of Japan
Open or CloseAppraisals of the Japanese economy also revealed an upward trend to match the rise and pace of the appraisal of the emotional component. When asked to appraise the 'Standard of Living' and 'Economic Power' of Japan from among four levels, the percentage of individuals who responded 'Somewhat Good' rose from 44% in 2008 to 54% in 2013 regarding the 'Standard of Living', and from 32% in 2008 to 44% regarding 'Economic Power,' marking an increase of around 10 points for both (#9.12d, #9.12c). However, the percentage of individuals who answered 'Very Good' dropped sharply from 1993 to 1998, and is also trending around 5% for this installment.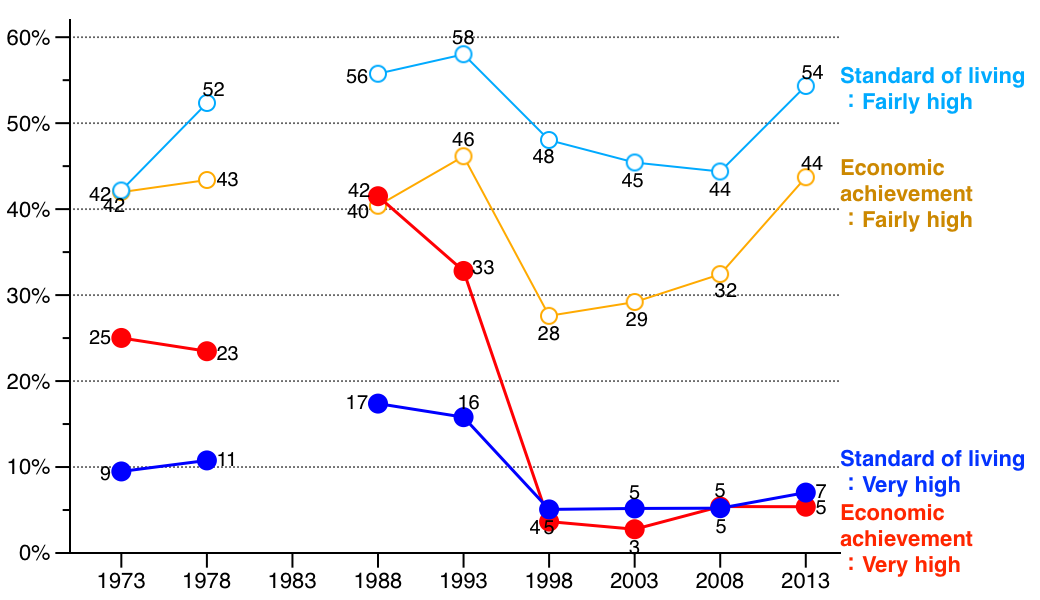
Figure 5. Appraisal of the 'Standard of Living' and 'Economic Power' of Japan
While the economy of Japan is being come to a new understanding, the individuals who responded that their own standard of living has actually 'Improved' or 'Somewhat Improved' in the past 10 years fell from 41% in 1993 to 20% in 2003, and remained at 20% for this installment as well (#7.30a). In contrast, the percentage of individuals who answered that it has 'Worsened' or 'Somewhat Worsened' rose from 13% in 1993 to 39% in 2003. And while the percentage of people who respond that their standard of living has worsened is continuing to decrease afterwards, the percentage of people who respond that it has not changed over the past 10 years is on the rise, and reached 53% in 2013.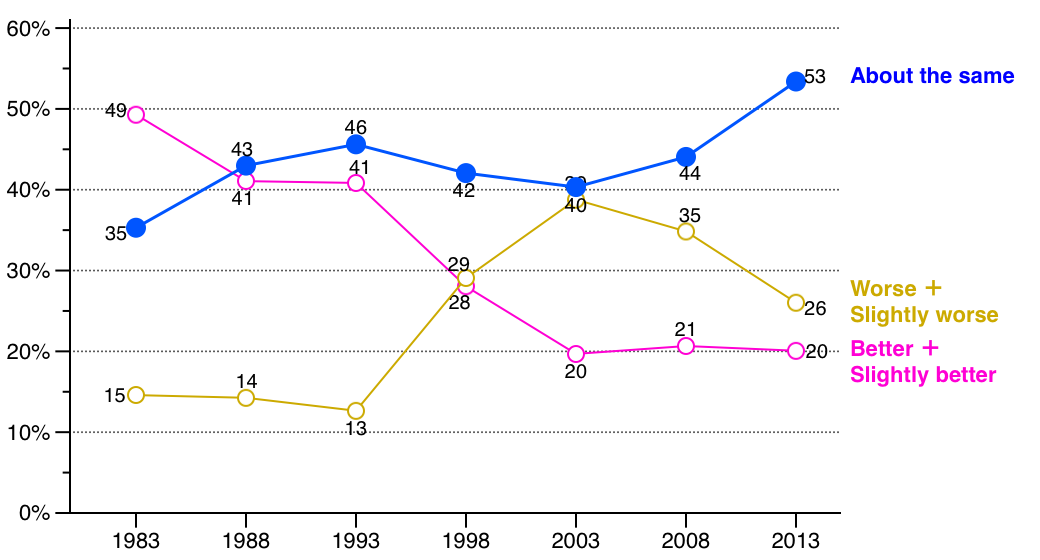
Figure 6. How has your standard of living changed in the past 10 years?
-
4. 'My Efforts Go Unrewarded' Response is on the Rise
Open or CloseWhen individuals were asked regarding their efforts towards their goals if they thought that 'If they gave an earnest effort, they would absolutely be rewarded' or they thought that 'No matter how much effort they made, they would often receive no reward at all,' individuals who answered that they 'Would receive no reward despite their efforts' rose almost 10 points from 17% in 1988 to 26% in 2013 (#7.38). The rise was apparent for both sexes and across all age groups, with the percentage of males in their 20s and 30s, in particular, which accounted for 1 out of 4 in 1988, exceeding 1 out of 3 in 2013.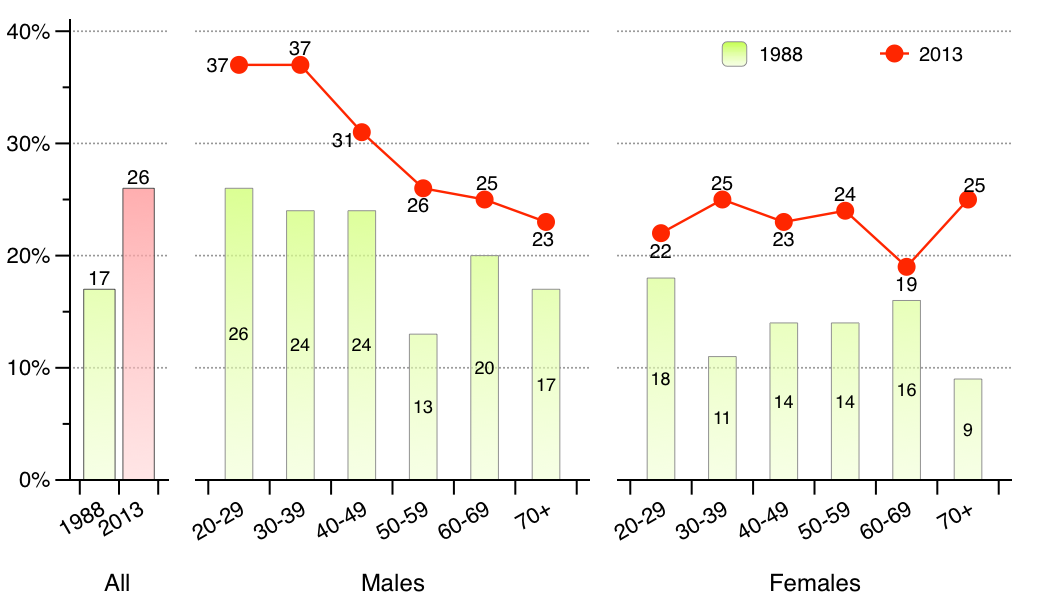
Figure 7. I Think that No Matter How Much Effort I Make, I Will Often Receive No Reward at All
There are various factors seemed to be behind the rise in responses of efforts going unrewarded, and an economic factor is one of those. Examining the cross tabulation of 'Changes to Living Standards over 10 Years' and 'Efforts Rewarded' shows that a high percentage of individuals who answered that their standard of living has worsened over 10 years, also answer that their 'Efforts go unrewarded.' This trend is similar for both sexes and across all age groups.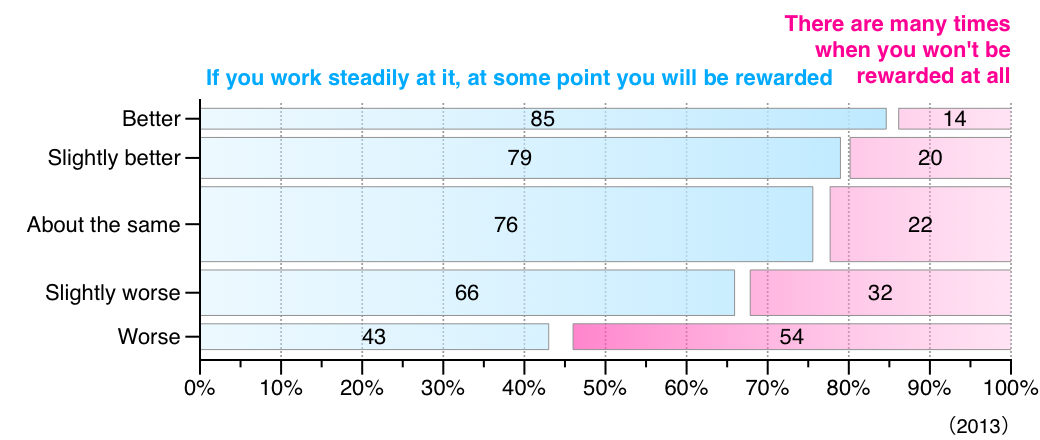
Figure 8. Changes to Living Standards over 10 Years and Efforts Rewarded
-
5. Endemic 'Frustration'
Open or CloseThe percentage of people who responded 'Yes' to being asked if they had become 'frustrated' in the past month has showed a gradual increase with each survey installment. In 2013, the percentage surpassed the percentage of people who answered 'No' (49%) since the survey item began in 1993 and reached 50% (#2.80c). The increase of people who answered 'Yes' was seen in both sexes and across all age groups, except those aged 60 and above; however, young women showed a particularly marked increase with 3 out of 4 women in their 20s and 30s answering 'Yes' to becoming 'Frustrated' in the past month for 2013.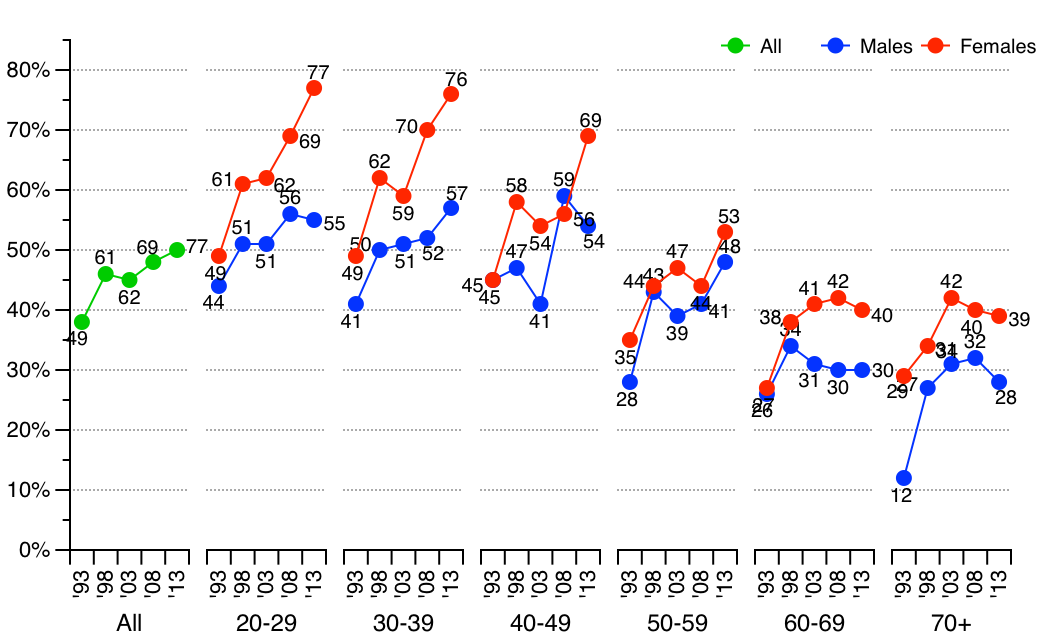
Figure 9. Have You Become 'Frustrated' in the Past Month?
Additionally, individuals who said that they had suffered from 'Headaches/Migraines' in the past month rose slightly from 25% in 1993 to 32% in 2013, with women in their 20s and 30s, in particular, exceeding 50% in 2013 (#2.80a).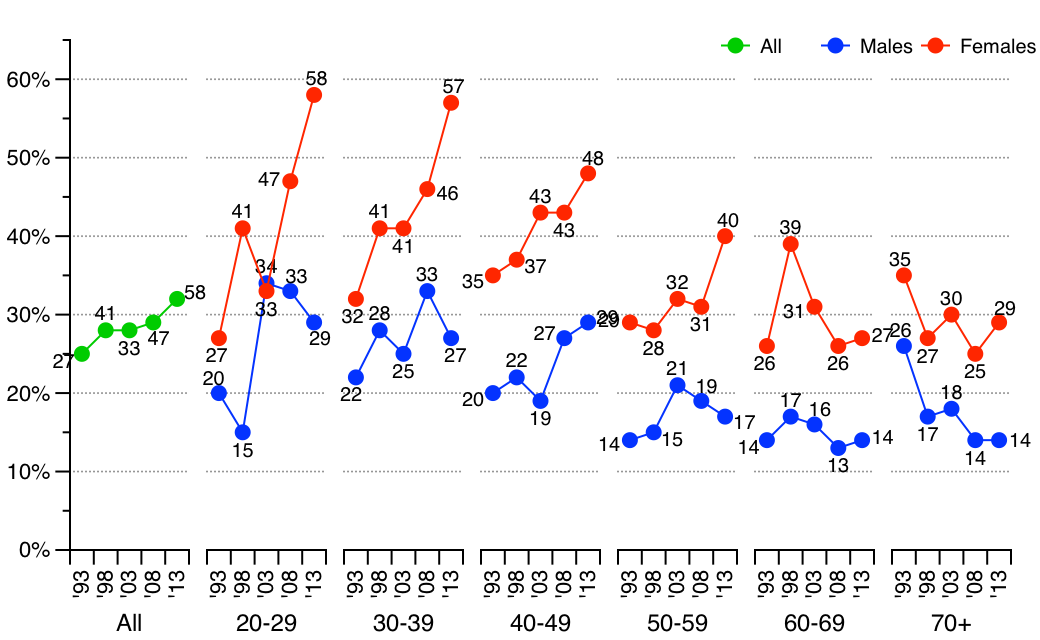
Figure 10. Have You Suffered from 'Headaches/Migraines' in the Past Month?
-
6. Number of Youth Wanting to 'Avoid Complications and Live Quietly' is Increasing
Open or CloseWhen individuals were asked to select which matched them best - 'I want to experience as much as I can to test my potential' or 'I want to avoid complications and live quietly'-, 80% of individuals in their 20s answered 'I want to experience as much as I can,' while 58% of individuals aged 70 or above chose 'I want to live quietly' 30 years ago in 1983, demonstrating a major difference in thinking across generations (#2.11b). However, in 2013, individuals in their 20s who selected to 'live quietly' rose from 19% to 31%, and individuals in their 30s similarly rose from 25% to 35%, marking an increase of over 10 points. A trend to desire a stable life over a diversity of experience is apparent among youth who, as indicated in the previous section, feel unrewarded or stressed. In contrast, the percentage of older age groups who desire 'a lot of experiences' is on the rise, and the difference among the generations is shrinking compared to that of 30 years ago.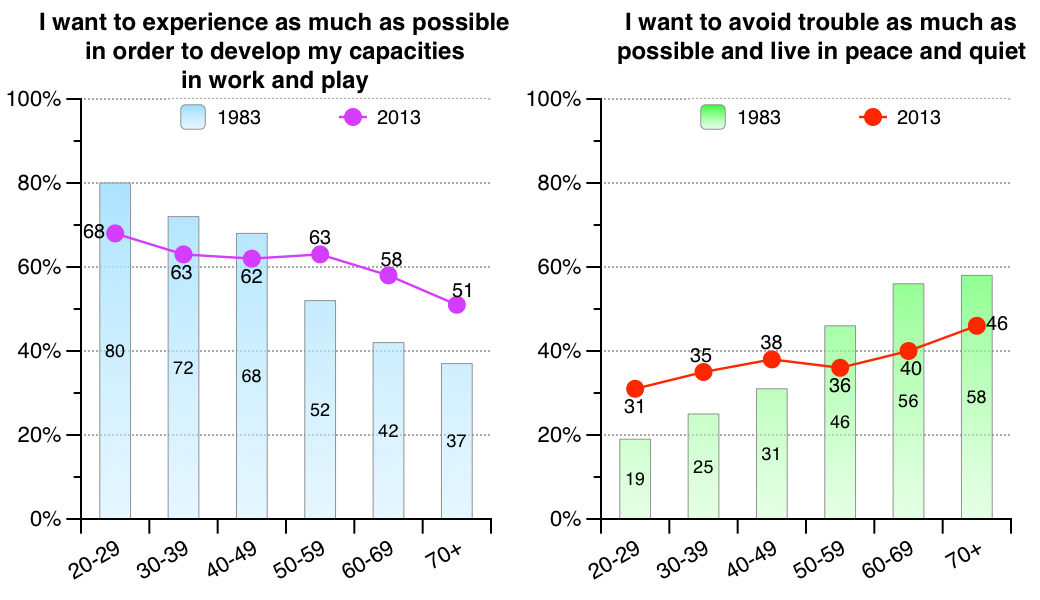
Figure 11. Test Your Potential?
In a related item, when individuals were asked which scenario was closest to their own feelings—'If I didn't have a job, but I did have money, life would be boring' and 'I don't think I would find life boring if I had money, but no job'—, less than 30% overall responded that they would not mind 'having money, but no job'; however, this percentage indicates a rising trend since 1983 (#7.25). The increase for young individuals in particular saw a marked increase, with the percentage doubling over 19% of 1983 for individuals in their 20s, reaching 40% in 2013.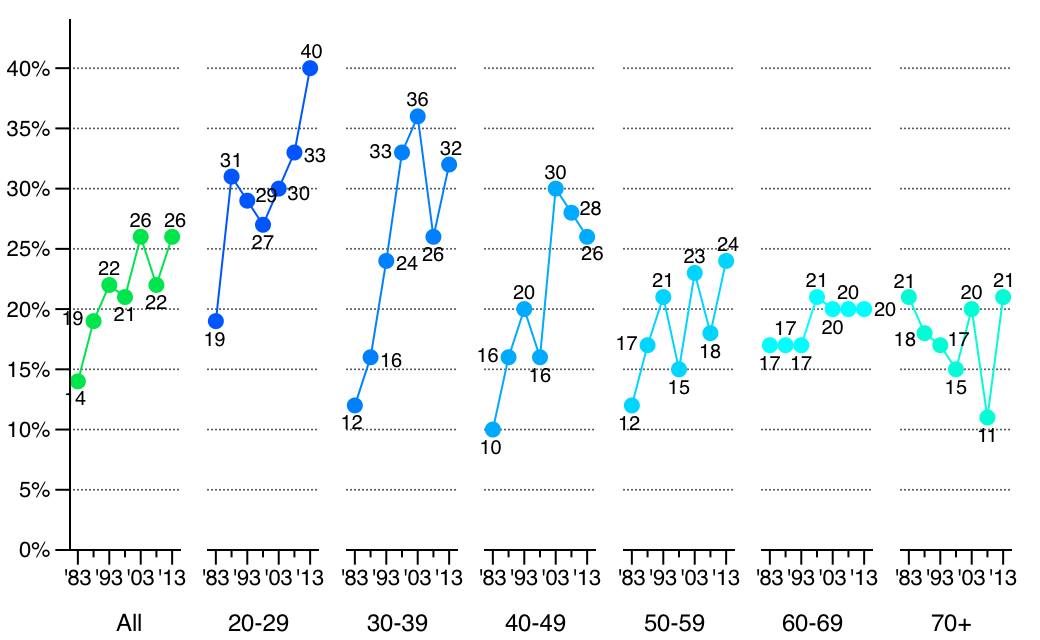
Figure 12. I Don't Think I Would Find Life Boring If I Had Money, but No Job
-
7. Outlook on the Future Begins to Shift towards Optimism Again
Open or CloseOptimistic outlooks on the future are on the rise again over pessimism. The percentage of individuals that answered 'I think people will be happier,' 'I think people will gain emotional tranquility,' 'I think human health will improve' was highest in 1978 and lowest around 2000; recent years, however, have seen an upward trend again (#7.18e, #7.18b, #7.18). There was a particular high percentage of optimistic outlook among those in their 20s, which saw 2013 higher than even 1978. For example, individuals in their 20s who responded 'I think people will be happier' rose to 42% in 2013.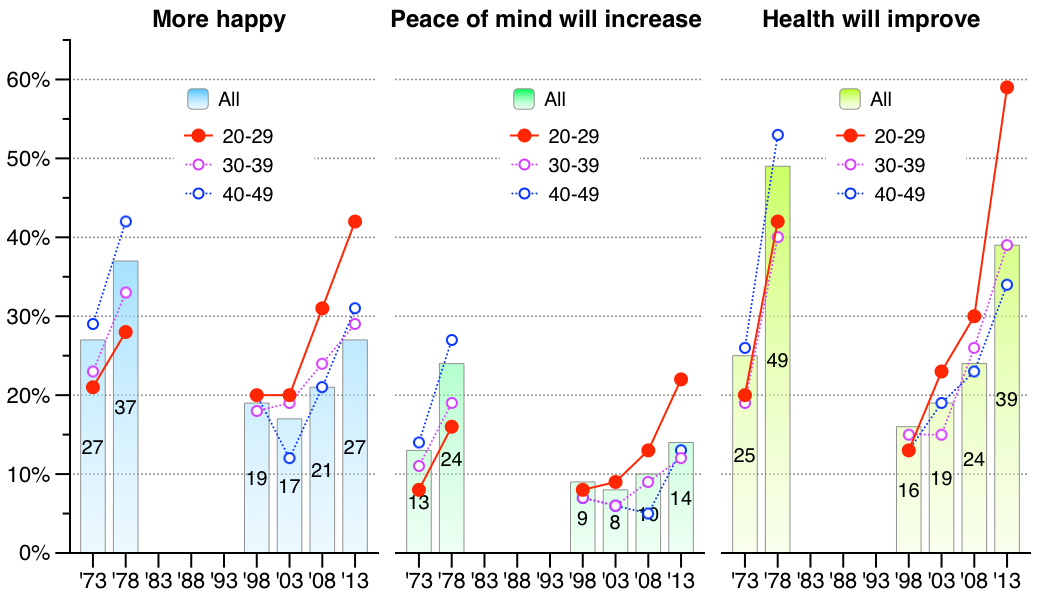
Figure 13. Outlook on the Future
This isn't just limited to the future; many people already feel happy about themselves. When asked to respond if they were simply 'Happy' (Includes somewhat, and mostly) or 'Unhappy,' 81% answered that they were 'Happy' in 1958 on the cusp of the high economic growth period, while this number rose to 94% 55 years later in 2013. Numbers for both sexes and all age groups exceed 90% (#2.3).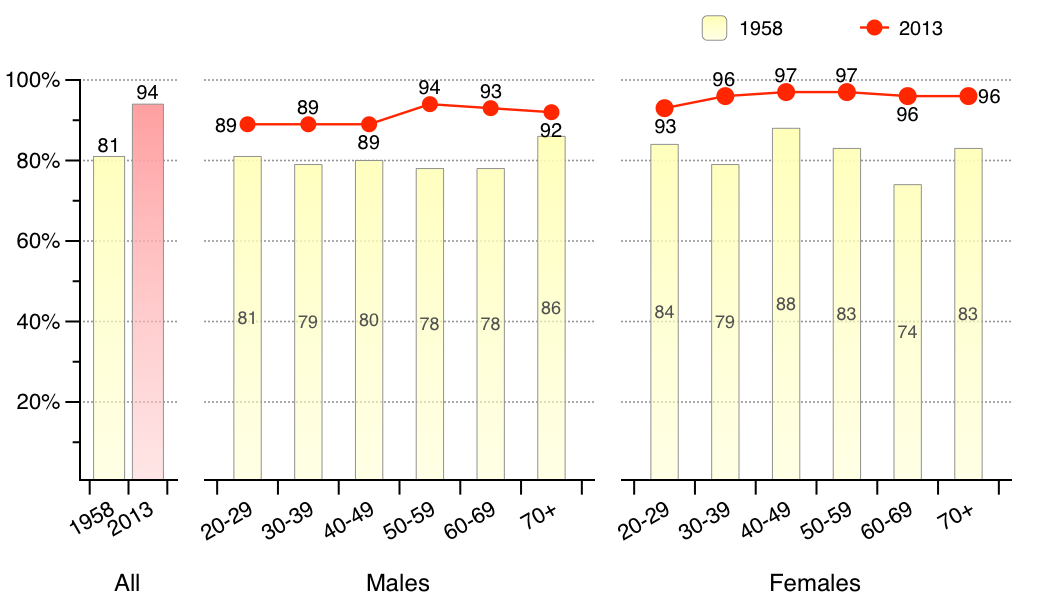
Figure 14. A Simple Question 'Are You Happy?'
Additionally, when individuals were asked to mark their happiness along an 11-step happiness index with 'very unhappy' being -5 and 'very happy' being 5, the percentage of individuals who marked their happiness with negative numbers was less than 10% for both sexes and across all age groups, with the exception of males in their 20s (#2.3*). On the other hand, those individuals who marked points at 1 or higher exceeded 50% for both sexes and across all age groups, and was more prevalent among younger age groups.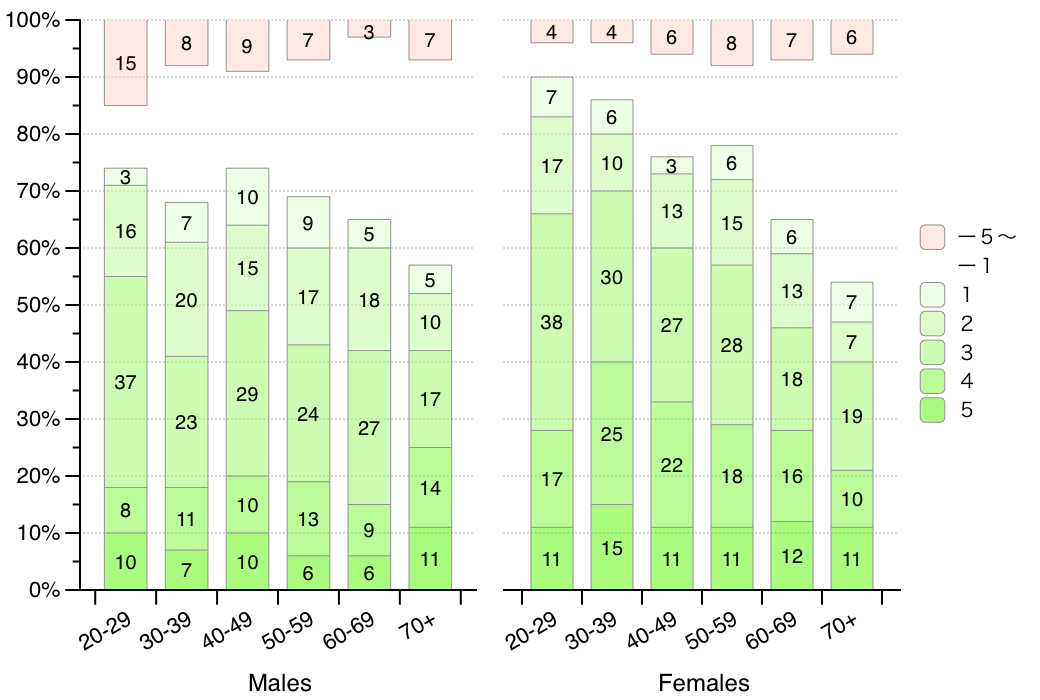 Figure 15. How Happy Are You Currently? Mark 5 for 'Very happy,' -5 for 'Very unhappy' and 0 for 'Normal' How Would You Rank Yourself?