One of the most important tasks in cluster analysis is to understand where
the estimated clusters come from, that is, identification of the group-related
features (genes). The mixed factors anslysis contains the buit-in module
detector where the some sets of genes relevant to the group structure are
automatically extracted. The ArrayCluster displays the expression patterns
of these modules. Investigating the listed genes at these relevant modules
and the visulalization would elucidate causul link from clustering to biological
knowlege.
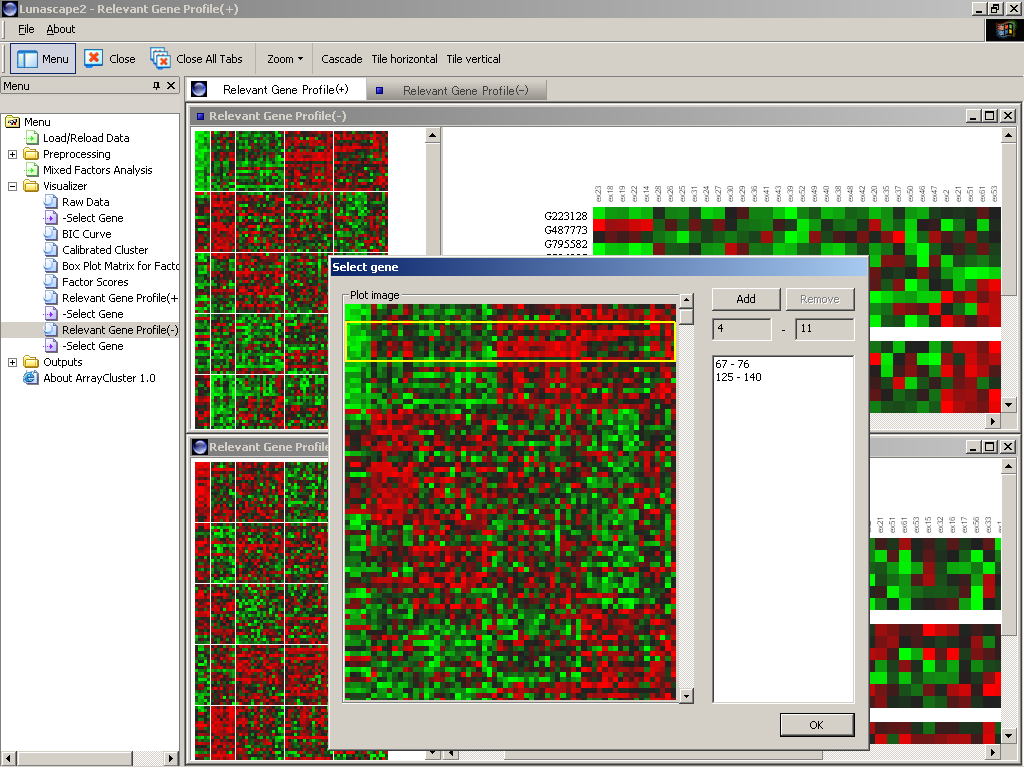
Visualizer
After running on Mixed_Factors_Analysis.exe and clicking "Relevant
Module Profile(+)" / " Relevant Module Profile(-)" on the
menu, the input file selection wizard will start. Selecting "relevant_set_+.txt"/
"relevant_set_-.txt" in the wizard, the expression matrix of
the selected q modules will be emerged in the GUI. At a time "Select
gene" window will open and ask which image of the gene expression
patterns are enlarged. After selecting rows (genes) of interest, the enlarged
expression image will be displayed on the right window (Figure 1).
Output File
A number of genes selected as the group-related modules are listed at
"relevant_set_+.txt"/ "relevant_set_-.txt" in
- \C:ArrayCluster\extents\lunamacplugin\data\ .
For example, if "Factor Dimension=5", "Number of Relevant Genes=20", total 100 genes and there expression values are written on each file whrer the first row denotes the file ID and the sample name, the next 20 rows denote the gene expressions of the first 20 genes to have the highest positive correlation with the first factor.
File format of relevant_set_+.txt / relevant_set_-.txt
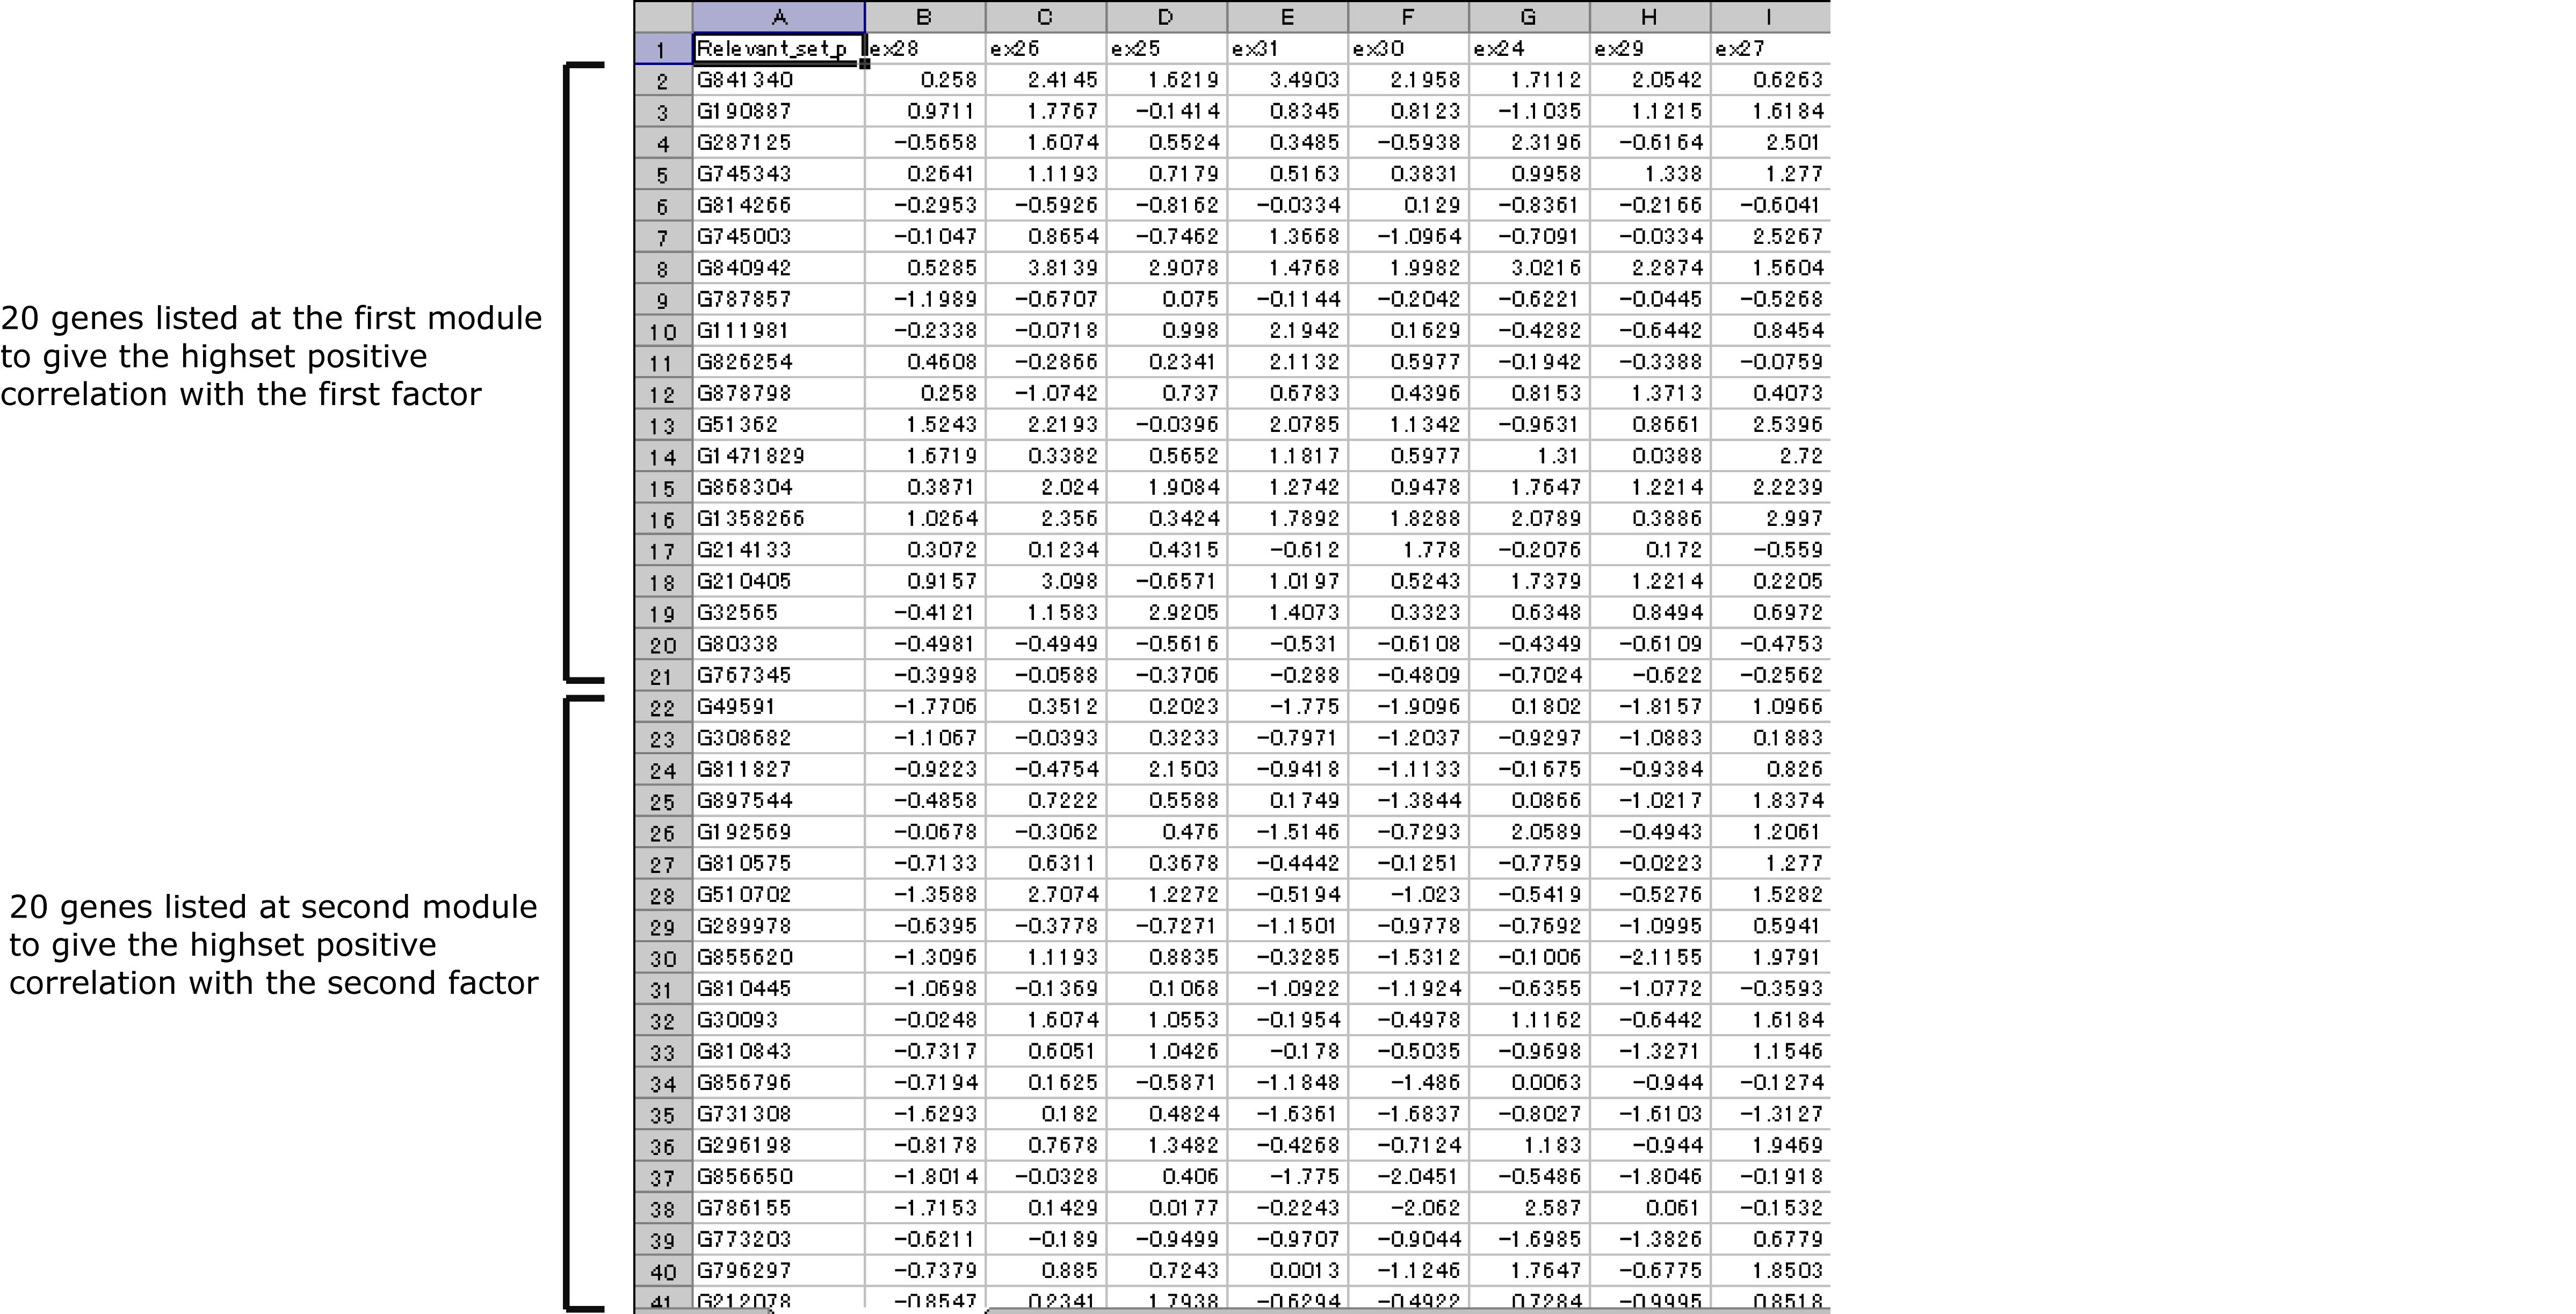
Figure 1: Image of the relevant module profiling