Mixed factors analysis contains a set of visualization tools for high-dimensional
microarray data. This task can be addressed by calculating factor scores
in much the same way as the classical factor analysis. A radical difference
of our method from the classical one is that the compressed data constructed
in the mixed factors analysis explicitly reflects the existing group structure
of data, while the classical method ignores the presence of groups during
the data compression process.
Visualizer
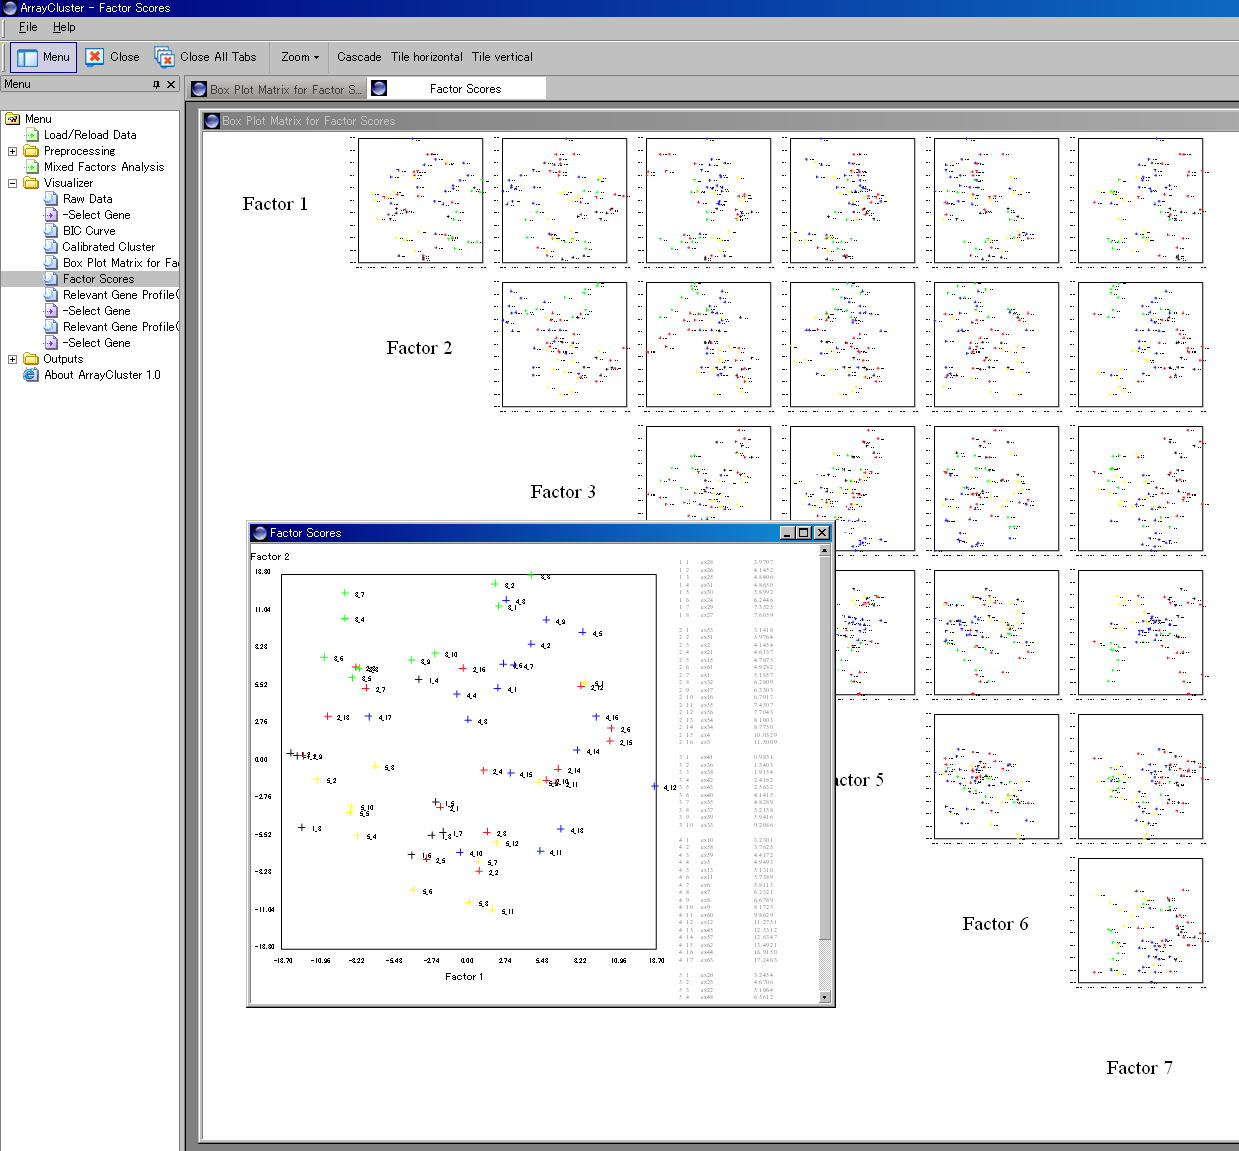
After running Mixed_Factors_Analysis.exe and clicking "Factor Score
Matrix", the wizard to visualize the box plot matrix of factor scores
will start. There, user can select three styles of sample names that are
labeled at data points. By viewing "Plot Image" in "Plot
Style Configuration", user can select one option. Then press "Finish".
Figure 1 displays a factor score matrix constructed with factor dimension
equal to 7. By investigating each data plot, user can understand the existing
groups of data, and elucidate a casual link between each coordinate of
factor variable and biological explanation.
The ArrayCluster can use zoom function of Lunascape. By the scale up or
down, user can focus on a part of box plots of interest. Or, by going to
"Factor Score" menu and selecting two axes of interest in the
"Select Mixed Factor Wizard", a large scaled box plot can be
displayed.
Output File
A data file for plotting factor scores, mixed_factors.txt is created at
- \C:ArrayCluster\extents\lunamacplugin\data\ .
File format of mixed_factors.txt
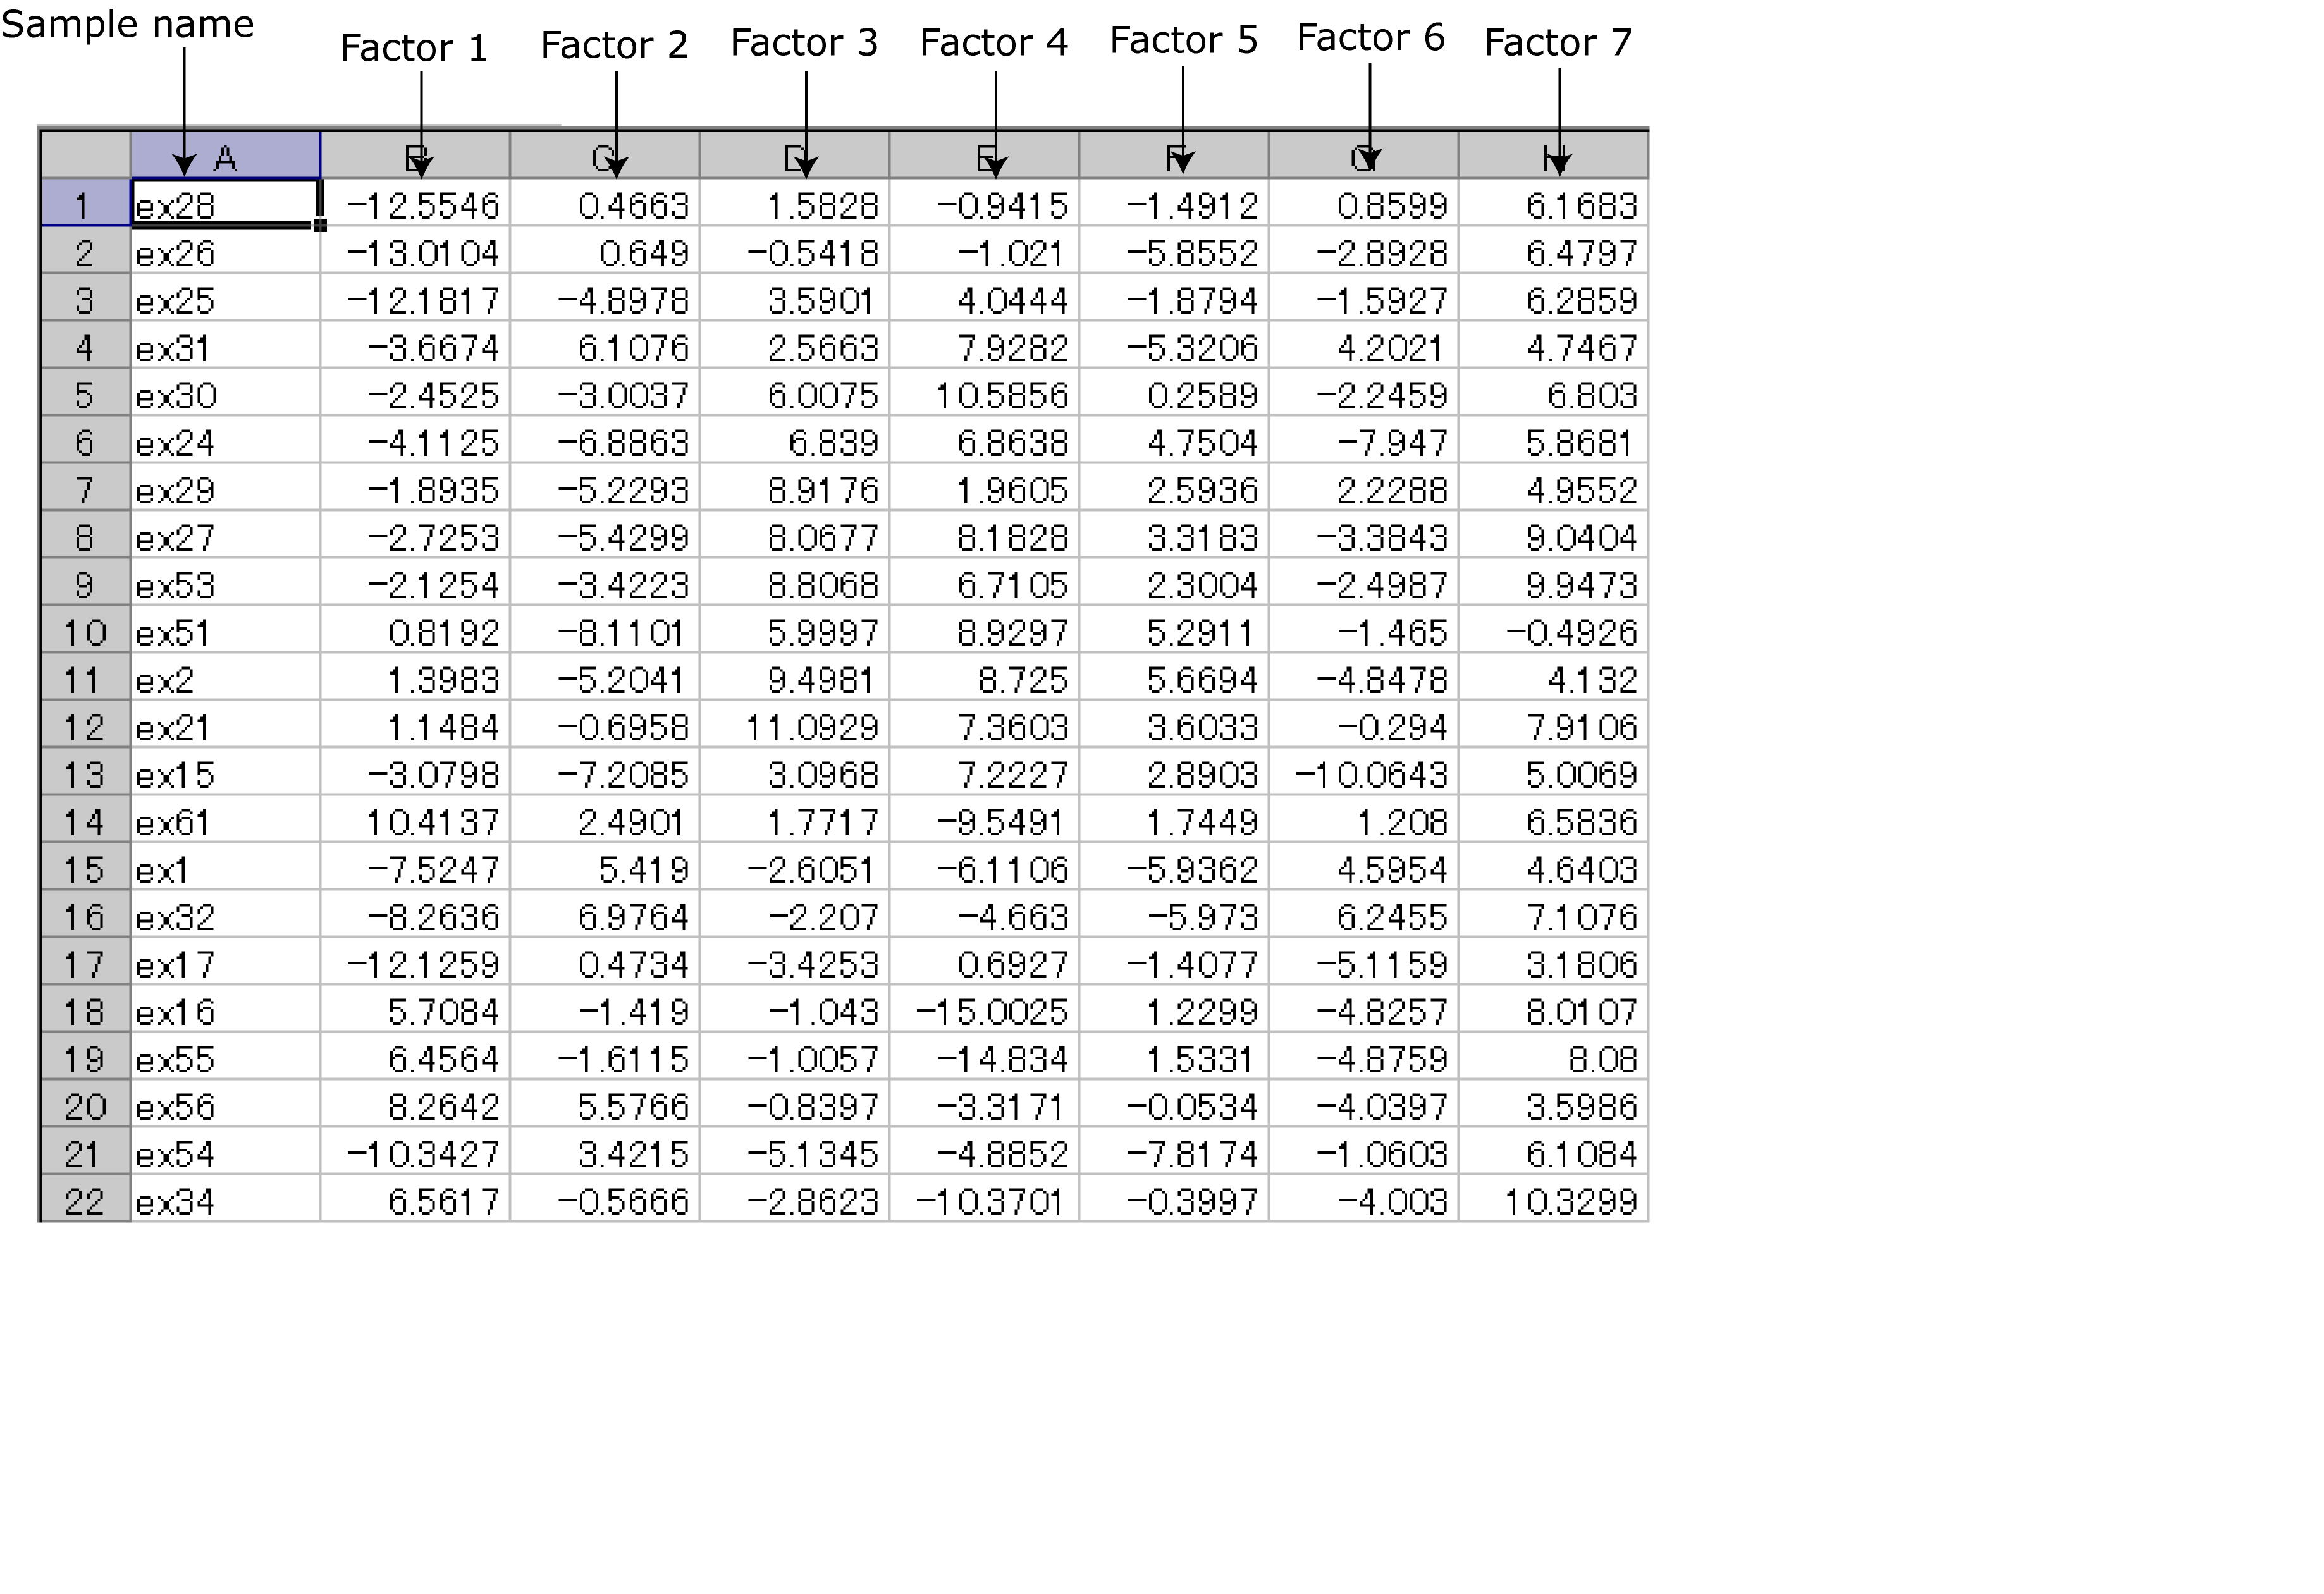
Figure 1: Box plot of the computed factor scores