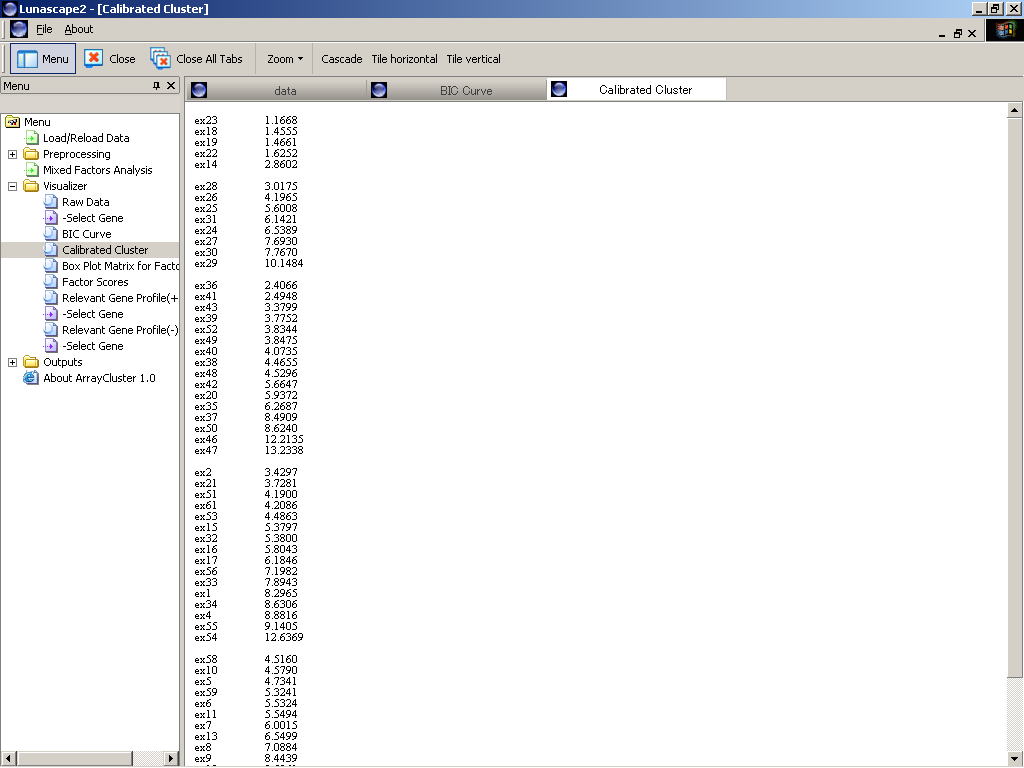
Visualizer
After running Mixed_Factors_Analysis.exe, clicking "Calibrated Cluster"
in "Visualizer", the result of clustering are summarized on the
browser as shown in Figure 1.
Each cluster is separated with the blank lines. All samples in one cluster
are ordered according to the degree of the belongings that are measured
by the Maharanobis distance between each sample point and the corresponding
group centeroid. The calculated distances are indicated next to the sample
identifiers.
Output File
The calibrated clusters are also checked through clustering.txt, created
at
- \C:ArrayCluster\extents\lunamacplugin\data\
File format are same with that in DOS-windows, as all samples in one cluster are ordered according to the degree of the belongings
that are measured by the Maharanobis distance between each sample point
and the corresponding group centroid.
Figure 1: Result of clustering displayed on the GUI of ArrayCluster
;