Display Style |
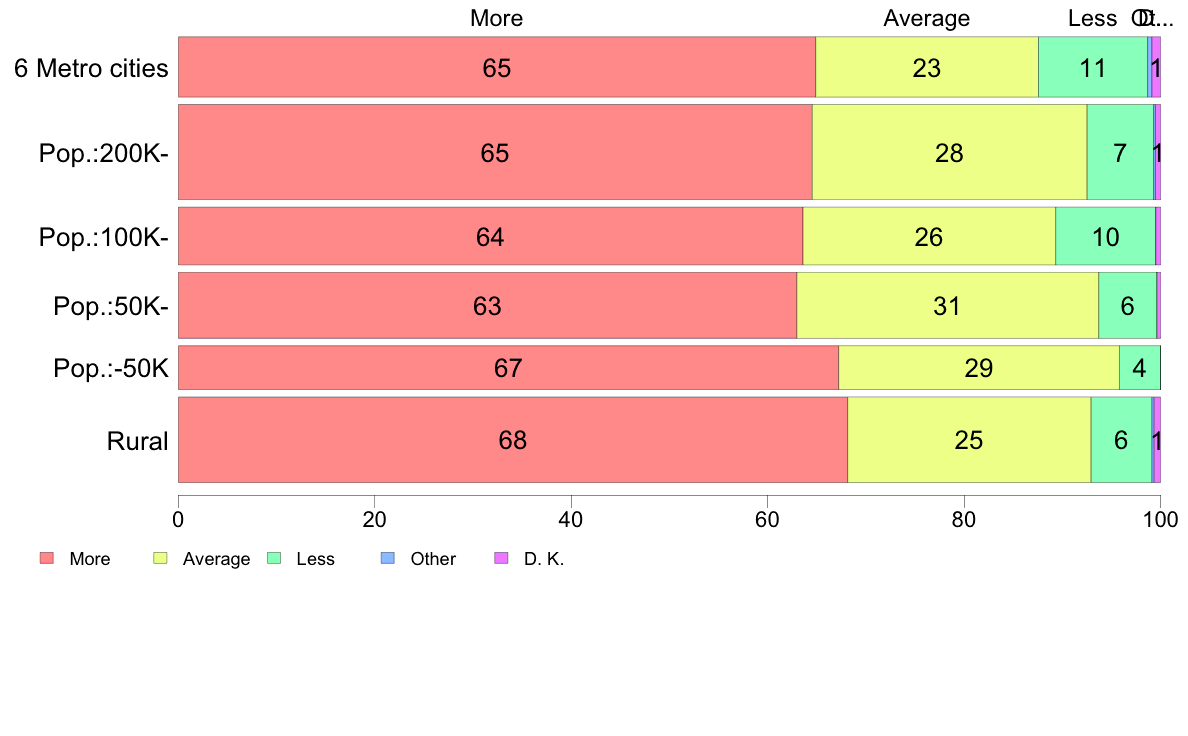
#4.11 Respect for ancestors
Would you say you are, on the whole, more inclined than the average (Japanese) to respect your ancestors or less?
| ||||||||||||||||||||||||||||||||||||||||||||||||||||||||||||||||||||||||||||||||||||||||||||||||||||||||||||||||||||||||||||||||||||||||||||||||||||||||||||||
| (C) 2017 The Institute of Statistical Mathematics |
Display Style |
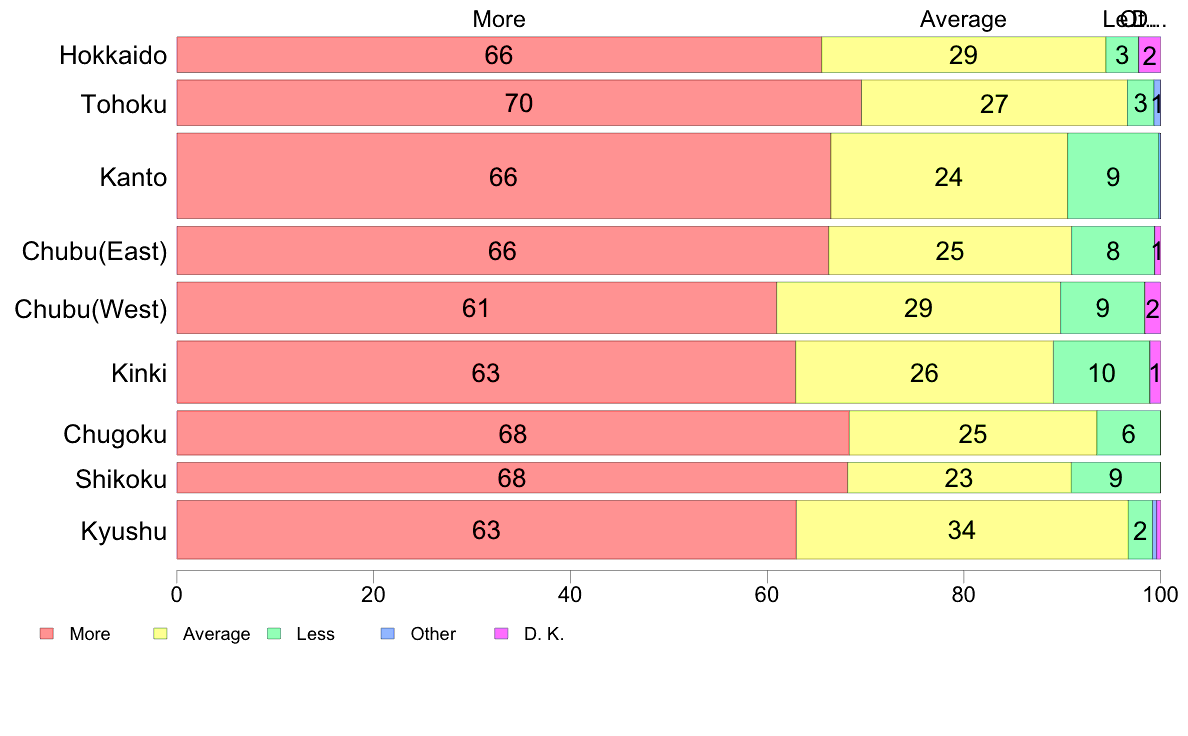
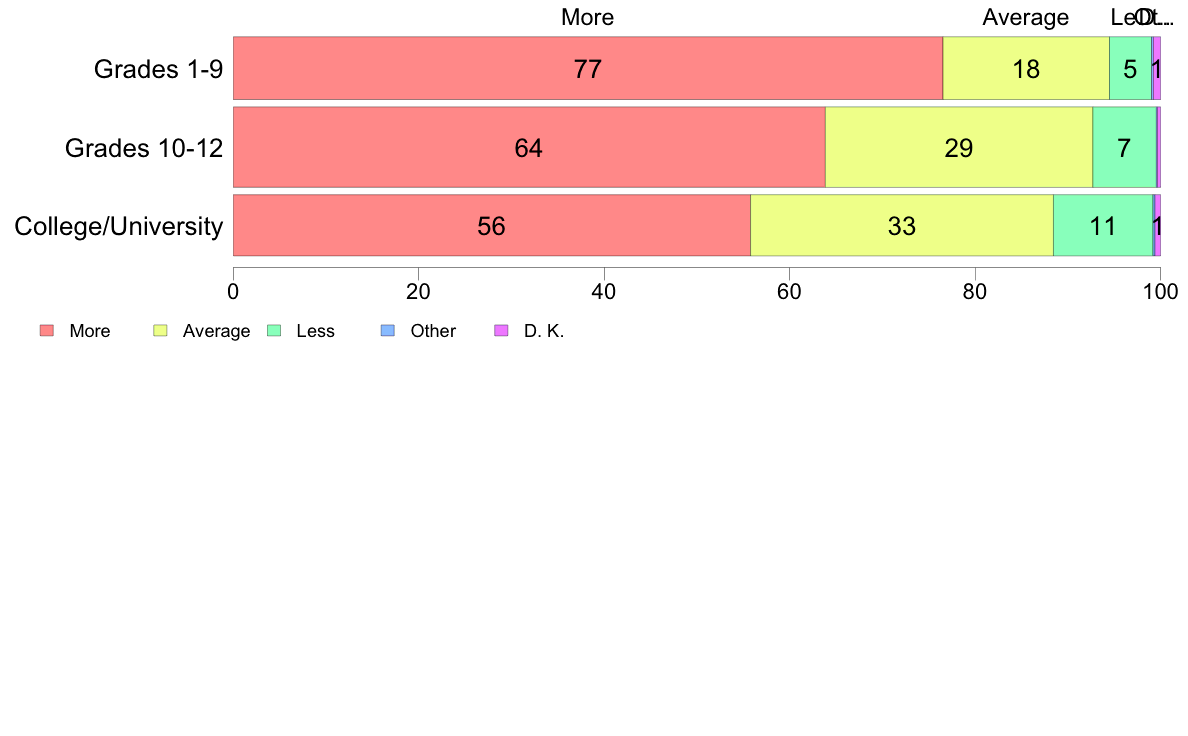
#4.11 Respect for ancestors
Would you say you are, on the whole, more inclined than the average (Japanese) to respect your ancestors or less?
| ||||||||||||||||||||||||||||||||||||||||||||||||||||||||||||||||||||||||||||||||||||||||||||||||||||||||||||||||||||||||||||||||||||||||||||||||||||||||||||||
| (C) 2017 The Institute of Statistical Mathematics |