Display Style |
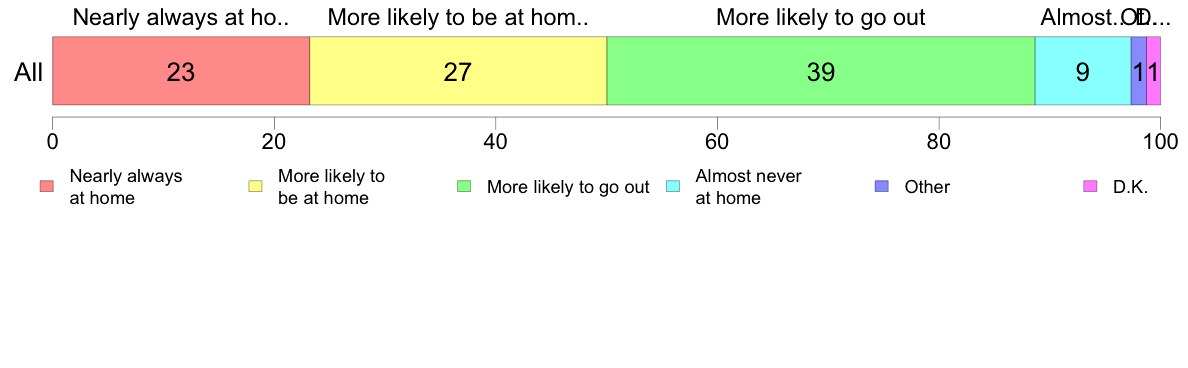
#1.80 At home on off day or not
(Hand Card) When you are off from work do you tend to be at home, or are you more likely to go out?
| ||||||||||||||||||||||||||||||||||||||||||||||||||||||||||||||||||||||||||||||||||||||||||||||||||||||||||||||||||||||||||||||||||||||||||||||||||||||||||||||||||||||||||||||||||||||||||||||||||||||||||||
| (C) 2017 The Institute of Statistical Mathematics |
Display Style |
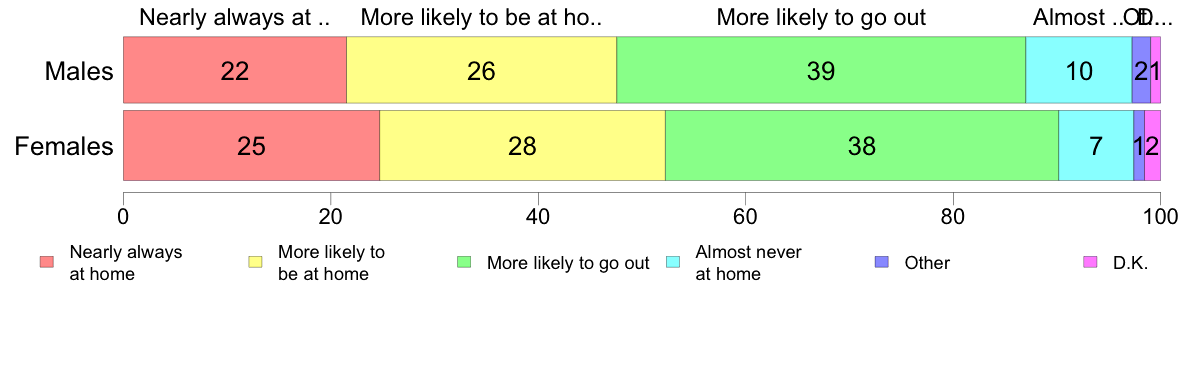
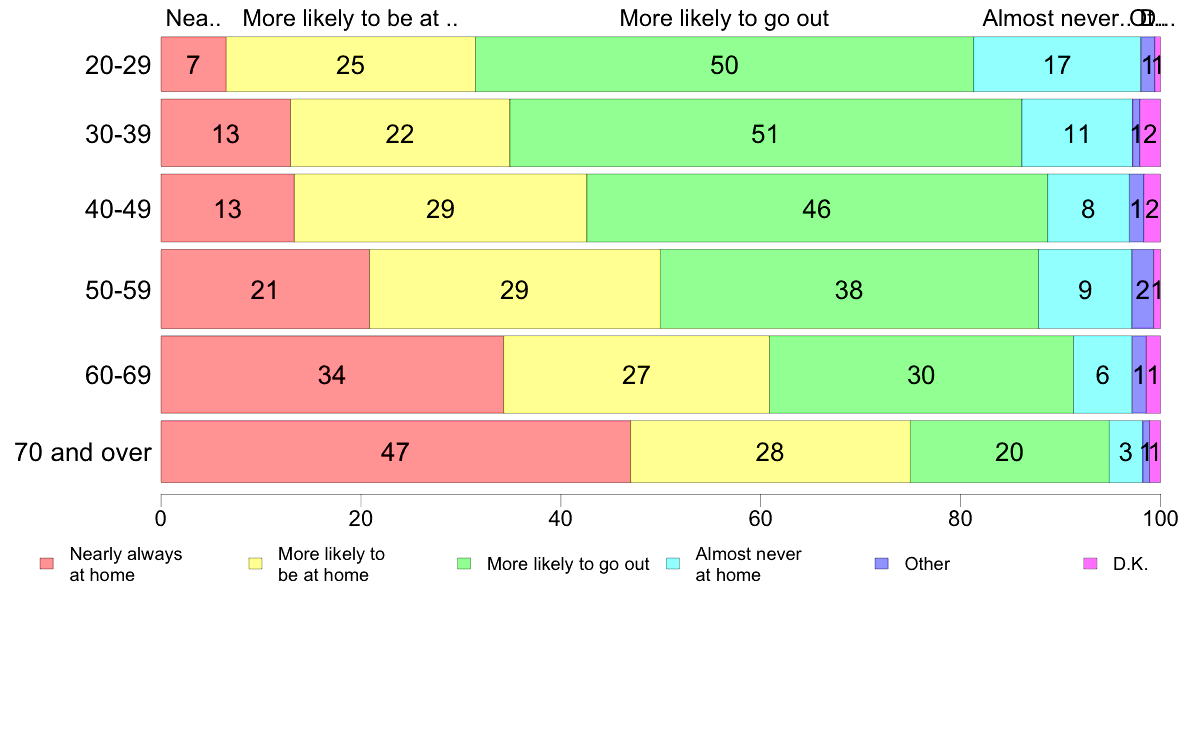
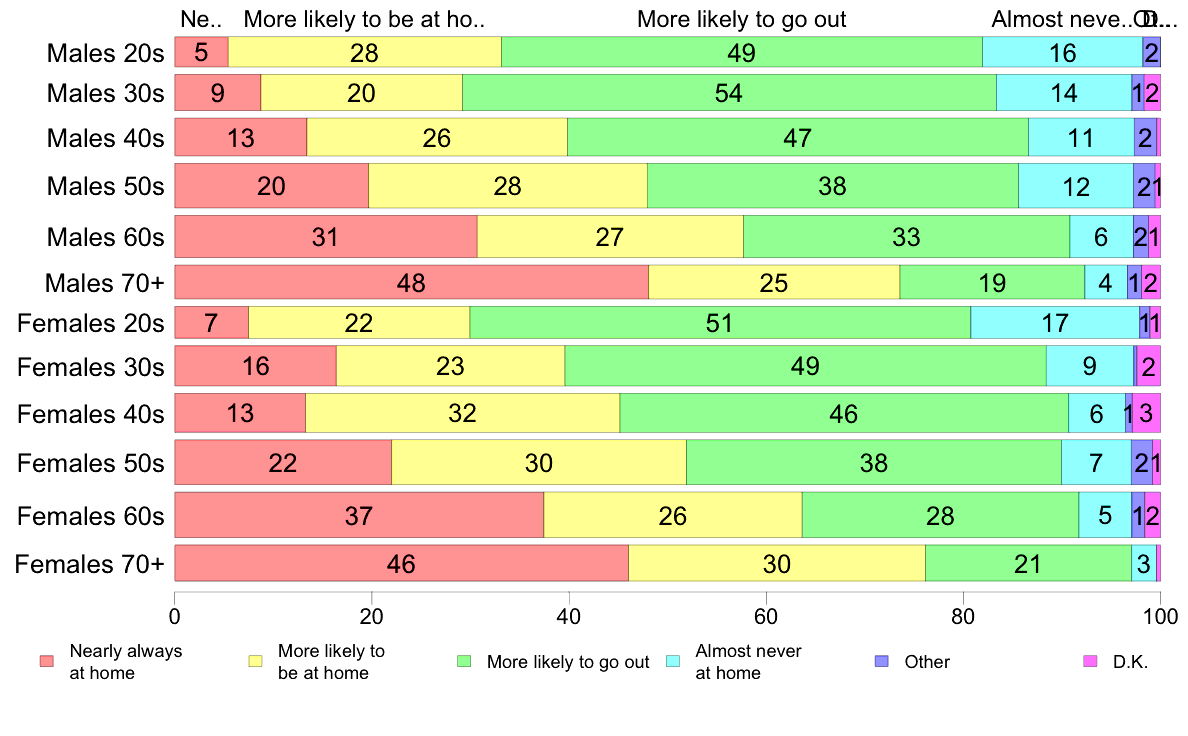
#1.80 At home on off day or not
(Hand Card) When you are off from work do you tend to be at home, or are you more likely to go out?
| ||||||||||||||||||||||||||||||||||||||||||||||||||||||||||||||||||||||||||||||||||||||||||||||||||||||||||||||||||||||||||||||||||||||||||||||||||||||||||||||||||||||||||||||||||||||||||||||||||||||||||||
| (C) 2017 The Institute of Statistical Mathematics |