Outline
Results
Links
Q & As
Display Style
Table
Graph
#1.1 Gender
[
Gender
]
1
Male
2
Female
Target : VIII (1988)
Total/Gender/Age
City/Region/Education
Male
Female
Total
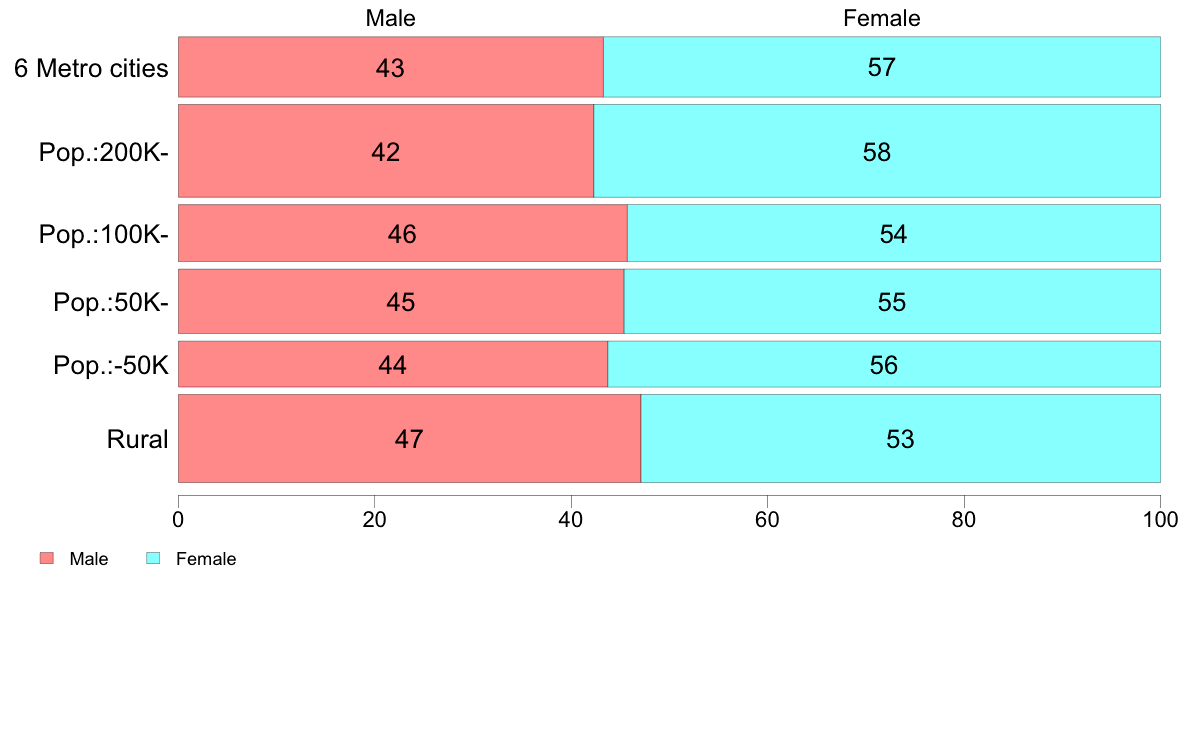
6 Metro cities
43
57
100
( 453)
Pop.:200K-
42
58
100
(1,073)
Pop.:100K-
46
54
100
( 407)
Pop.:50K-
45
55
100
( 520)
Pop.:-50K
44
56
100
( 263)
Rural
47
53
100
( 966)
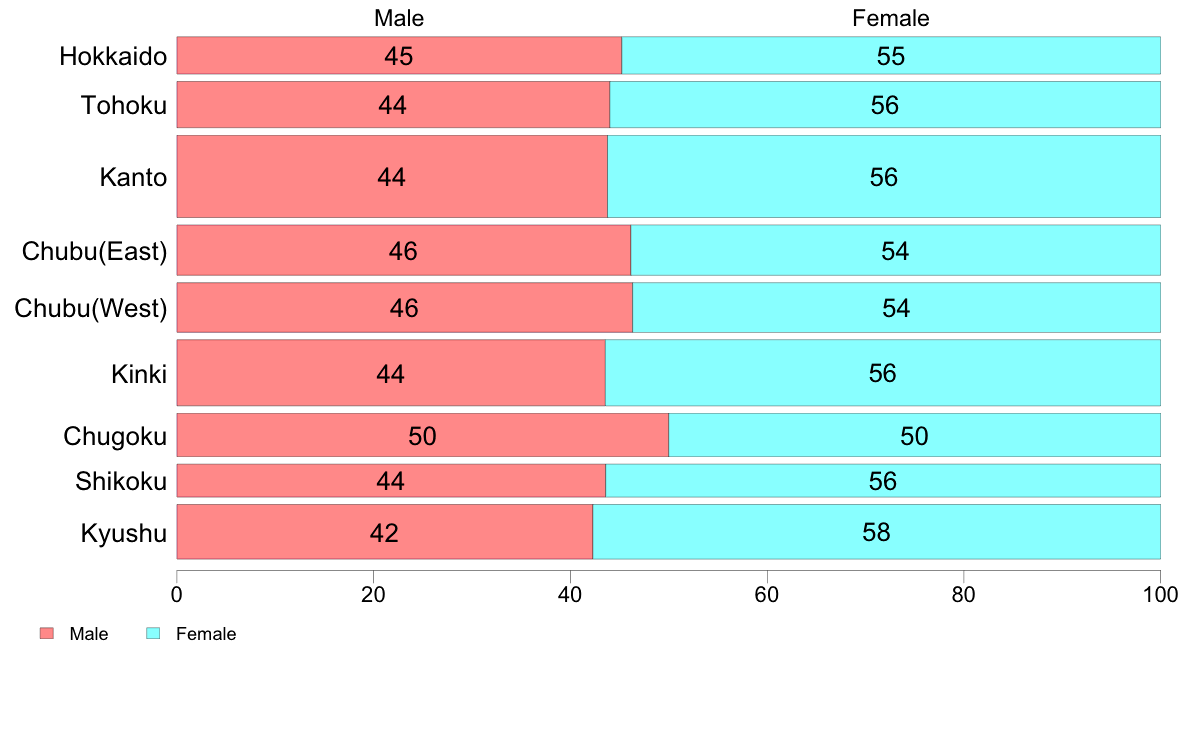
Hokkaido
45
55
100
( 199)
Tohoku
44
56
100
( 309)
Kanto
44
56
100
( 973)
Chubu(East)
46
54
100
( 364)
Chubu(West)
46
54
100
( 354)
Kinki
44
56
100
( 627)
Chugoku
50
50
100
( 272)
Shikoku
44
56
100
( 156)
Kyushu
42
58
100
( 428)
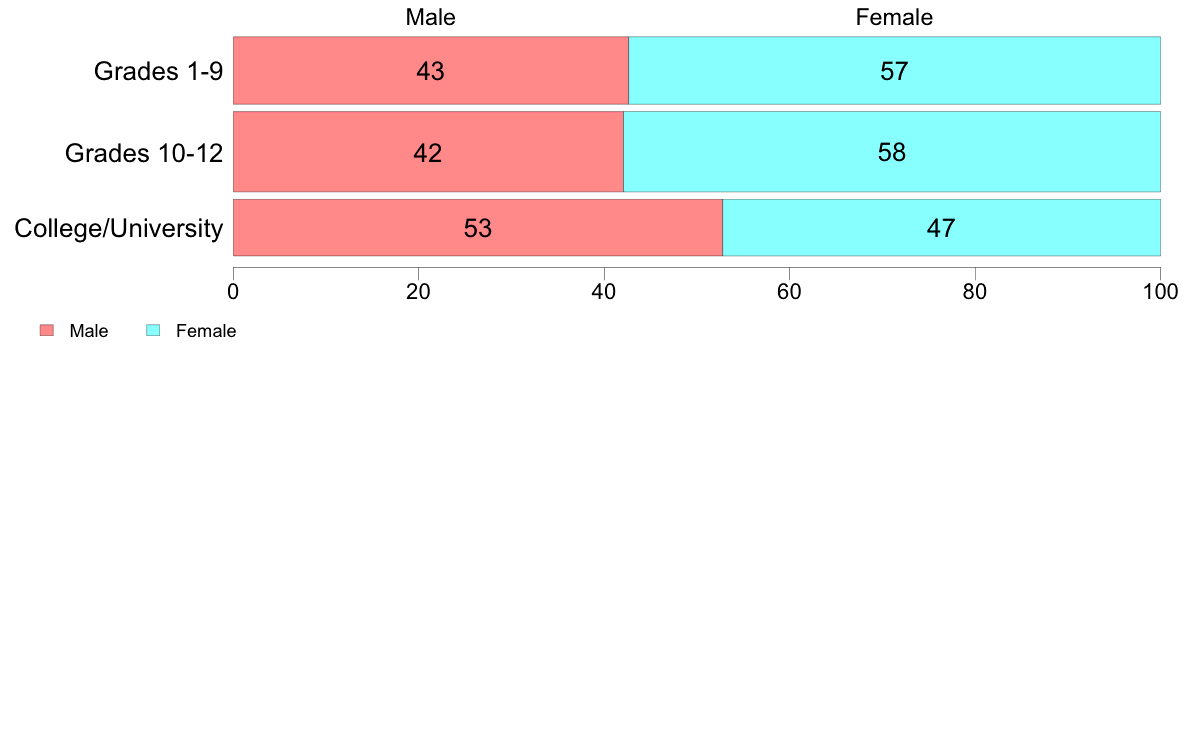
Grades 1-9
43
57
100
(1,168)
Grades 10-12
42
58
100
(1,656)
College/University
53
47
100
( 826)
(C) 2017 The Institute of Statistical Mathematics