Outline
Results
Links
Q & As
Display Style
Table
Graph
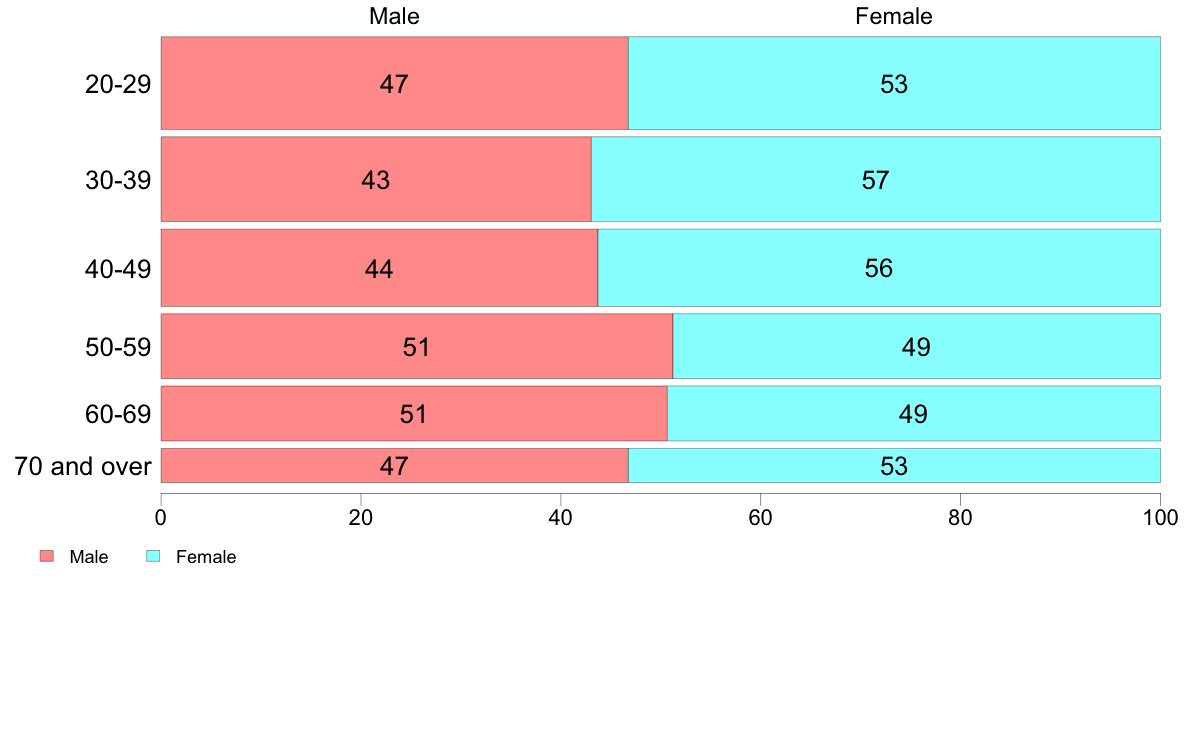
#1.1 Gender
Male
Female
Target : II (1958)
All
Gender
Age
Gender * Age
Cities
Region
Education
All Response Categories
Male
Female
(C) 2017 The Institute of Statistical Mathematics