2008年
岩手宮城内陸地震前の断層南部周辺の地殻変動について
Aseismic slip scenario for transient
crustal deformations around the southern fault before the 2008 Iwate-Miyagi
Inland earthquake
統計数理研究所
The Institute of
Statistical Mathematics
第182回地震予知連絡会で,2008年6月14日の岩手・宮城内陸部地震(M7.2)に先立つ10年余りの地震活動の経緯を報告した1).これは南部の震源断層2)内の一定の前駆すべりを仮定して,東北地方と周辺部でのクーロン破壊応力の増減に基づいて地震活動の変化の説明を試みたものである.また断層西部直近の領域で約1年前から地震活動が顕著に活発化したことから,すべりは深部延長部に移動したものと考えた.
国土地理院は栗駒山の火山性力源変化の可能性を考えてモニターしたところ,栗駒2観測点で2004年から2007年にかけて周辺の観測点とは異なる傾向の変動を観測した.そして,これは震源断層南部における前駆すべりモデルでも説明可能であるとしている3).しかし地震直前前1年間地殻活動は(特に皆瀬の変動)は同断層深部延長面のすべり1)では説明できないとしている3).
そこで本報告では,すべりを仮定した断層部の周辺の観測所間の基線距離の時系列を調べてみた.第1図は1999年11月から本震時までの断層を跨ぐ基線を含む周辺部の観測基線の時系列を見たものである.2つの時点に基線間距離の変動に飛びが見られる.自明なのは2005年宮城県沖の地震(M7.1)に伴うものである.もう一つは2003年の三陸南の地震(M7.2)や宮城県北部地震(M6.1)に関係するようにみえる.が飛びの方向が逆センスであり皆瀬(C)観測点の基線に共通して地震以前に現れているのが特徴的である.2005年の地震時の飛び以後,胆沢−湯沢
(A-I) 及び胆沢−皆瀬 (A-C) の基線を除き前半のトレンドと後半のトレンドの傾きが違う.これを全て宮城県沖地震のポストサイスミックな変化とするには時期が長すぎると思う.
上に記したように2004年7月より,すべり断層の直上にある栗駒2を含む断層近傍の観測点のデータが得られている.第2図に示すような栗駒2を結ぶような基線距離の時系列を示した.少なくとも2005年8月15日までのトレンドによると,周りのGPS観測点と比べて南東方向への移動が見られる.コサイスミック及びポストサイスミックな変動が顕著な栗駒−栗駒2(G-H)のみならず,北東−南西方向のA-H,
E-Hを除く,他の基線でも1‐2年前から有意なトレンド変化が見られる.これらは概ねそれまでの伸長・収縮していた基線が停滞している様にみえる.この事から,それまでのすべりが深部に移動し弱まるか,止まったと考えられる.
さらに第2図のB-H,
C-H, D-HおよびG-H基線の地震2か月前からの同期した伸長・収縮は前期のトレンドと調和しており、すべりが再開したことを示唆している。
(熊澤貴雄, 尾形良彦)
参考文献
1)
統計数理研究所,
2009, 地震予知連絡会報, 82, 96-105.
2)
Ohta, Y., M. Ohzono,
S. Miura, T. Iinuma, K. Tachibana, K. Takatsuka, K. Miyao, T. Sato, and
N. Umino (2008), Earth Planets Space, 60,
1197-1201..
3)
国土地理院, 2010, 地震予知連絡会報, 83, 59-81.
|
Station |
Name |
ID |
Lon.
(deg.) |
Lat.
(deg.) |
|
A |
胆沢 |
970796 |
140.9885
|
39.1270
|
|
B |
東成瀬 |
020928 |
140.7150
|
39.1462
|
|
C |
皆瀬 |
950193 |
140.6296
|
39.0519
|
|
D |
雄勝 |
020929 |
140.4473
|
39.0544
|
|
E |
最上 |
020931 |
140.4973
|
38.7522
|
|
F |
鳴子 |
950174 |
140.8016
|
38.7489
|
|
G |
栗駒 |
950173 |
140.9906
|
38.8153
|
|
H |
栗駒2 |
020913 |
140.8332
|
38.9340
|
|
I |
湯沢 |
960554 |
140.5067
|
39.1991
|
Table 1.
The name, ID, location of the GEONET stations by the GSI (see Figures 1 and
2)..
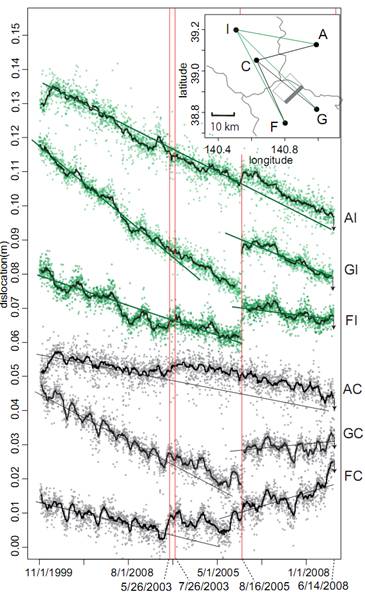
第1図 1999年11月から本震時までの断層を跨ぐ基線を含む周辺部の観測基線(右上の挿入図および表1参照)の時系列(緑点・灰色点)と1月間幅のメディアン(実線)。赤縦線は左から順に2003年宮城県沖地震(三陸南地震)、2003年宮城県北部地震および2005年宮城県沖地震の時点.
Fig. 1. Daily time series (green and grey
dots) of the baseline distance changes around the source fault (see inset map)
over 10 years’ period from 24 May 1999 to the day before the earthquake of
13 June 2008. The inset map shows the locations of GEONET stations (see Table 4
for the detail), and the gray rectangle represents the source (see Table
1). The thick curves link medians of moving window over a month (31 days)
of base-line distance changes, f, and thin straight lines illustrate their linear
trends. The vertical red lines correspond to the timing of the neighboring
large earthquakes, namely, the 26/5/2003 Sanriku-Minami
earthquake of M7.2, the 26/7/2003 Northern Miyagi-Ken earthquake of M6.1, the
16/8/2005 Miyagi-Ken Oki earthquake of M7.1, and the 14/6/2008 Iwate-Miyagi
Inland earthquake of M7.2. The right end arrows show the directions of jumps at
time of the 2008 mainshock.
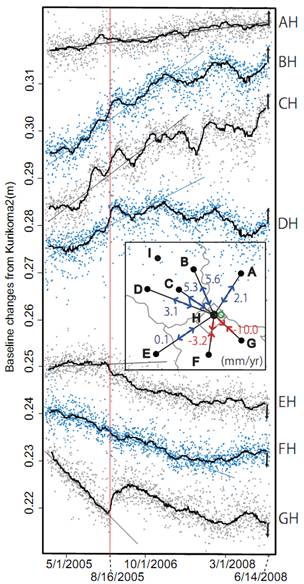
第2図 2004年7月から本震時までの栗駒2とむすぶ周辺部の観測点との基線(右上の挿入図および表1参照)の時系列(青点・灰色点)と1月間幅のメディアン(実線)。赤縦線は2005年宮城県沖地震の時点.右上の挿入図の矢印と数字は1年当りの基線の伸長・収縮率。
Fig. 2.
Daily time series (grey and blue dots) of the baseline distance changes from
Kurikoma2 to each stations in the inset, over 4 years’
period from July 2004 till 13 June 2008 (just before the rupture). The area of
the inset map is the same as in Figure 12. The details of each station are
listed in Table 4. The thick curves and the overlaid linear lines represent the
same as in Figure 12. The vertical red lines correspond to the timing of the 16
Aug 2005 Miyagi-Ken-Oki earthquake of M7.1. The arrows at the end of period
indicate directions of the coseismic moves of the 14
Jun 2008 Iwate-Miyagi Inland earthquake of M7.2. In the inset map, the numbers
between station H (Kurikoma2) and each other station show changed distance in milli-meters per-year during the period from 1st Jul 2004
to 1st Jul 2007.
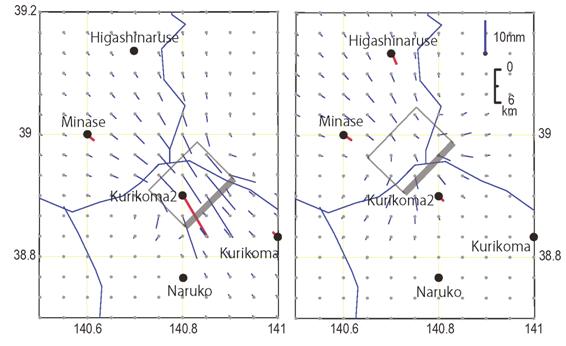
第3図 ゆっくりすべりに基づく地殻変動の計算(左は断層内すべりで右は深部延長部のすべり)
Fig. 3.
Vectors show the theoretical surface movement by assuming the fault (gray
rectangle) slip, in the 1/100 scale of the Iwate-Miyagi Prefecture Inland
earthquake. The rectangle in the left panel represents the southern part of the
rupture fault model, and the one in the right panel its down-dip extension. The
GPS stations within the maps are marked by disks and their vectors are in red
color.