Display Style |
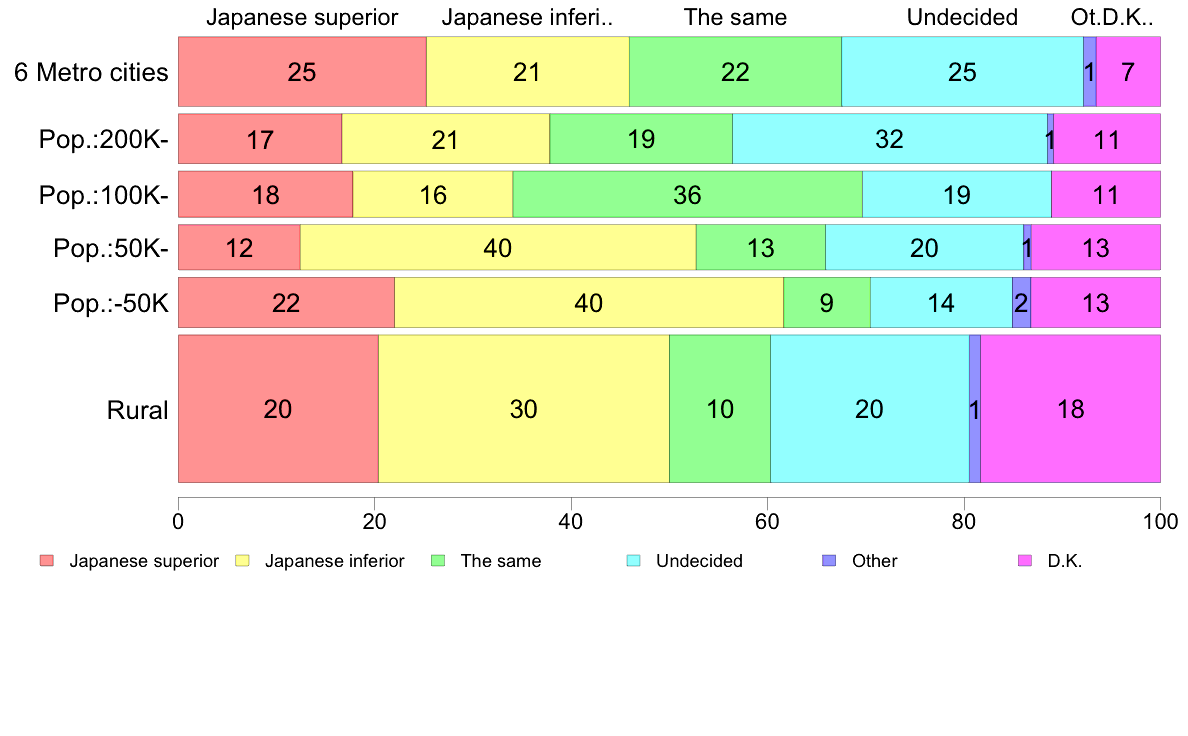
#9.6 Superior or inferior: Japanese and Western people
Generally speaking, would you say that the Japanese people are superior to, or inferior to Western peoples?
| |||||||||||||||||||||||||||||||||||||||||||||||||||||||||||||||||||||||||||||||||||||||||||||||||||||||||||||||||||||||||||||||||||||||||||||||||||||||||||||||||||||||||||||||||
| (C) 2017 The Institute of Statistical Mathematics |
Display Style |
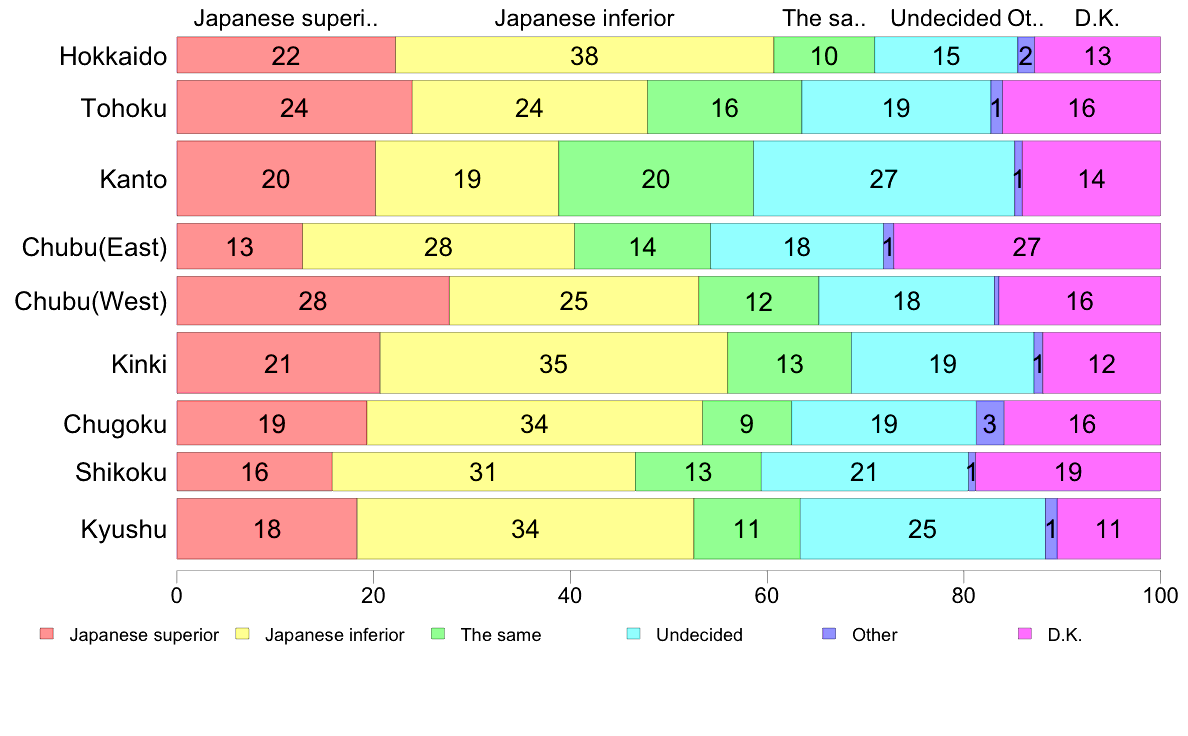
#9.6 Superior or inferior: Japanese and Western people
Generally speaking, would you say that the Japanese people are superior to, or inferior to Western peoples?
| |||||||||||||||||||||||||||||||||||||||||||||||||||||||||||||||||||||||||||||||||||||||||||||||||||||||||||||||||||||||||||||||||||||||||||||||||||||||||||||||||||||||||||||||||
| (C) 2017 The Institute of Statistical Mathematics |