Outline
Results
Links
Q & As
Display Style
Table
Graph
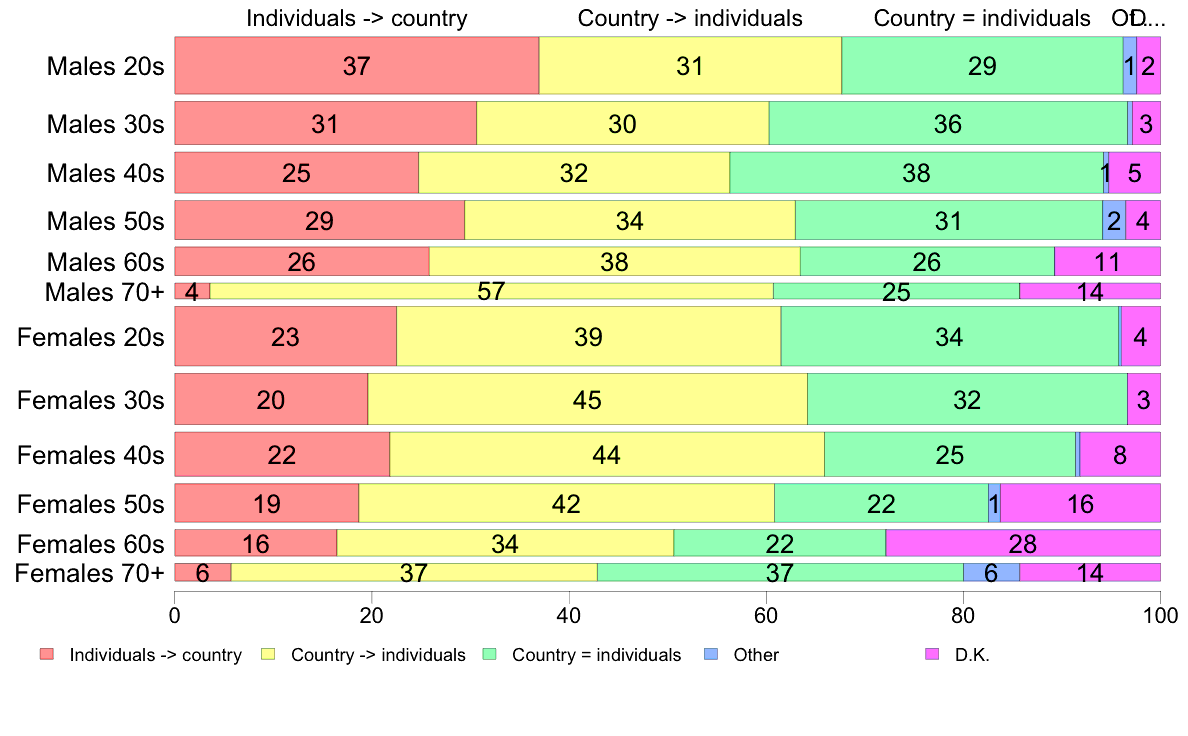
#7.4 Improve the country or make people happy
Please choose from among the following statements the one with which you agree most. (
Hand card)
1
(A)
2
(B)
3
(C)
4
D.K.
5
Other(Specify)
Target : I (1953)
All
Gender
Age
Gender * Age
Cities
Region
Education
All Response Categories
Individuals -> country
Country -> individuals
Country = individuals
Other
D.K.
(C) 2017 The Institute of Statistical Mathematics