Display Style |
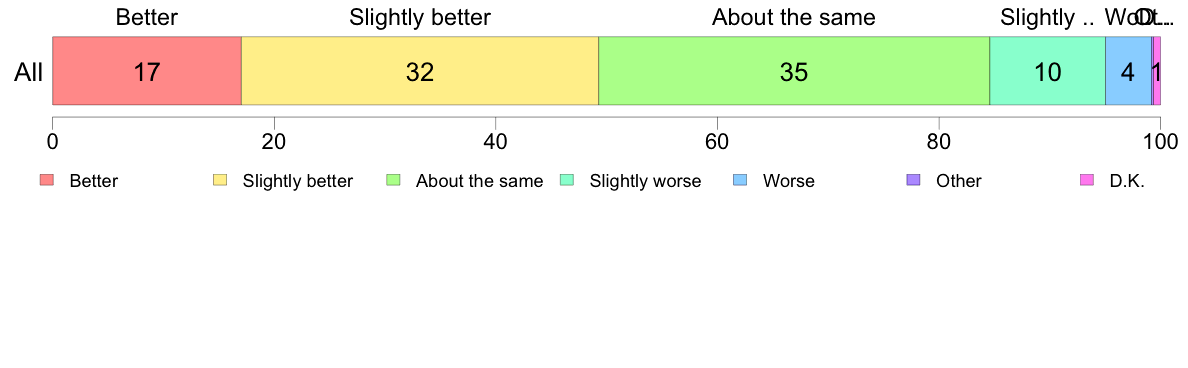
#7.30a Your standard of living in last ten years
(Hand card) Compared with ten years ago do you think your standards of living is ...
| ||||||||||||||||||||||||||||||||||||||||||||||||||||||||||||||||||||||||||||||||||||||||||||||||||||||||||||||||||||||||||||||||||||||||||||||||||||||||||||||||||||||||||||||||||||||||||||||||||||||||||||||||||||||||||||||||||
| (C) 2017 The Institute of Statistical Mathematics |
Display Style |
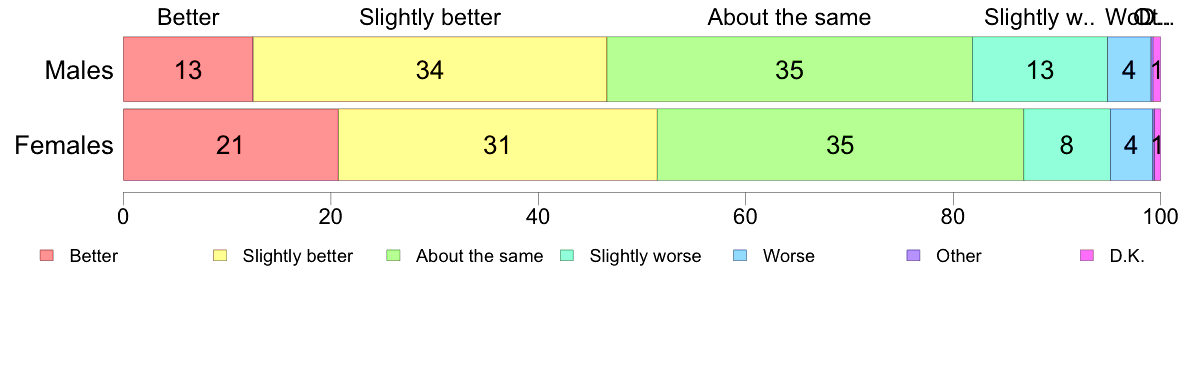
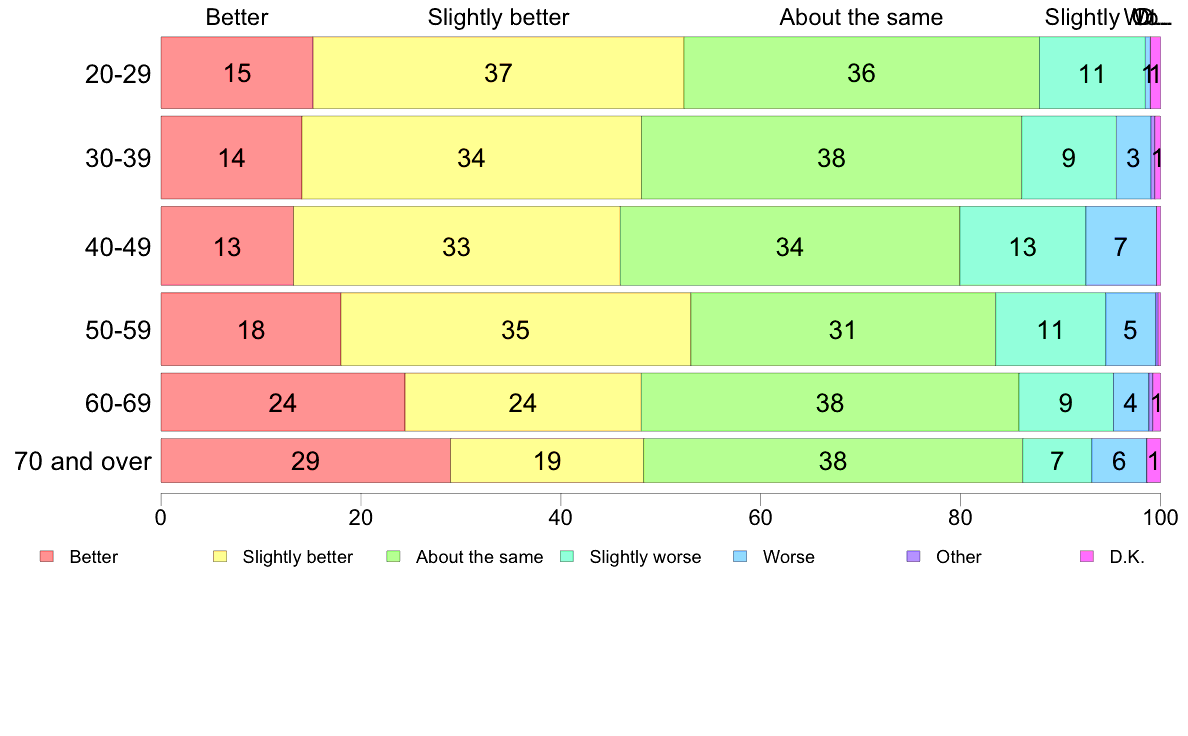
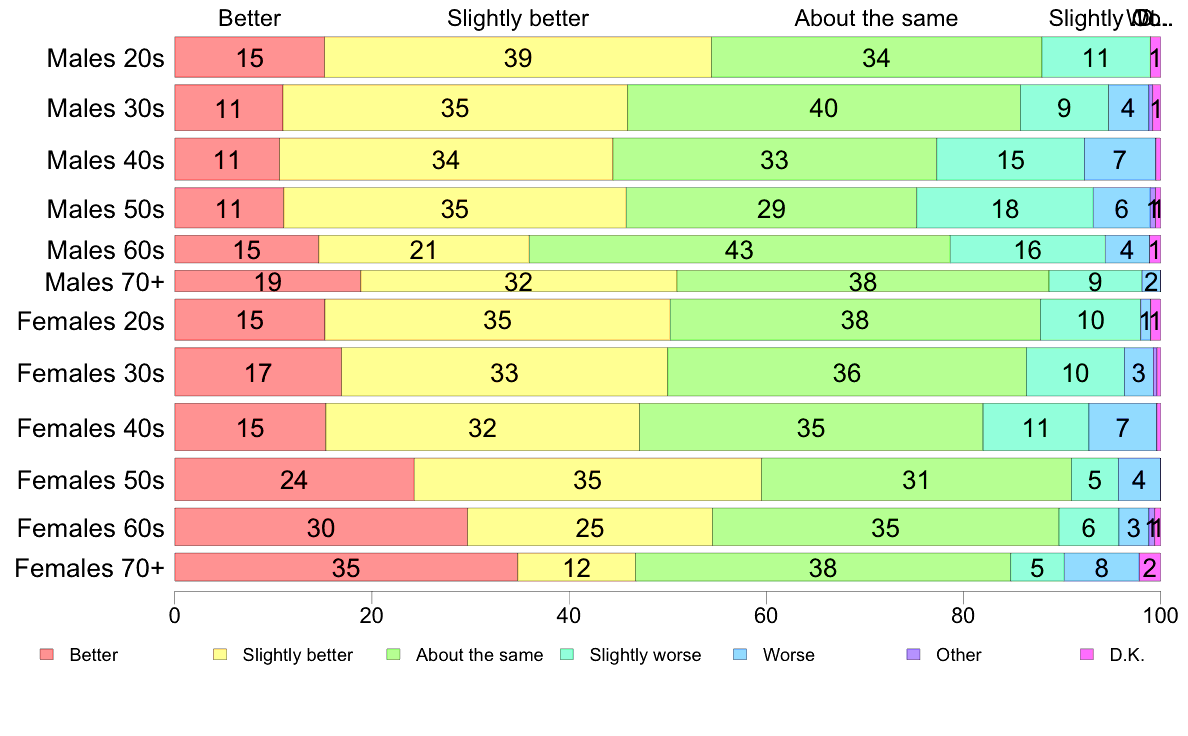
#7.30a Your standard of living in last ten years
(Hand card) Compared with ten years ago do you think your standards of living is ...
| ||||||||||||||||||||||||||||||||||||||||||||||||||||||||||||||||||||||||||||||||||||||||||||||||||||||||||||||||||||||||||||||||||||||||||||||||||||||||||||||||||||||||||||||||||||||||||||||||||||||||||||||||||||||||||||||||||
| (C) 2017 The Institute of Statistical Mathematics |