Display Style |
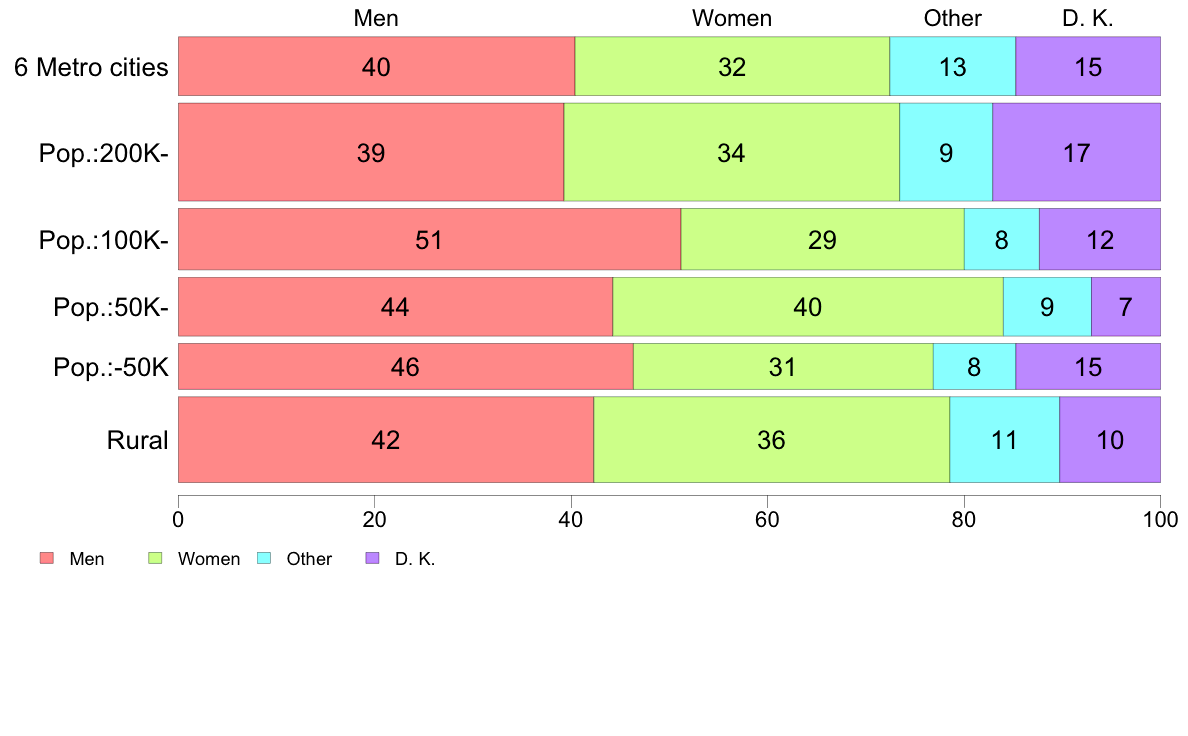
#6.2d Gender with life of pleasure
Then, which do you think gets the greater pleasure out of life, men or women?
| |||||||||||||||||||||||||||||||||||||||||||||||||||||||||||||||||||||||||||||||||||||||||||||||||||||||||||||||||||||||||||||||||||||||||||
| (C) 2017 The Institute of Statistical Mathematics |
Display Style |
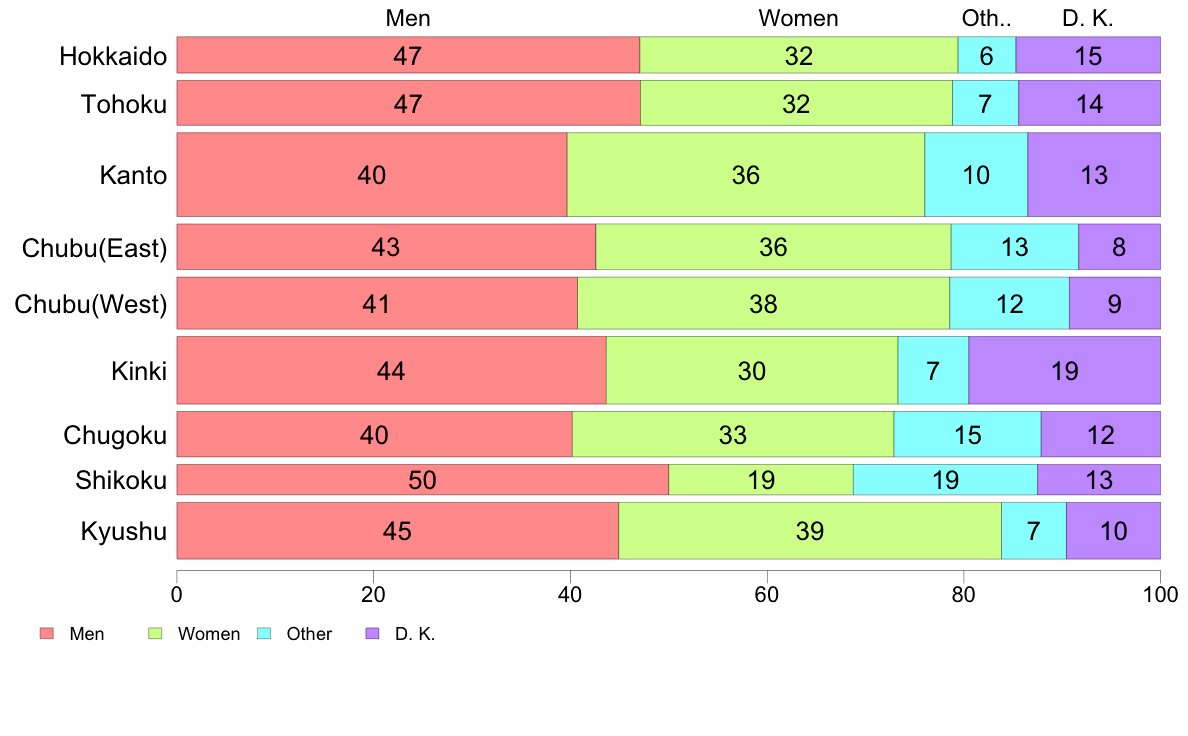
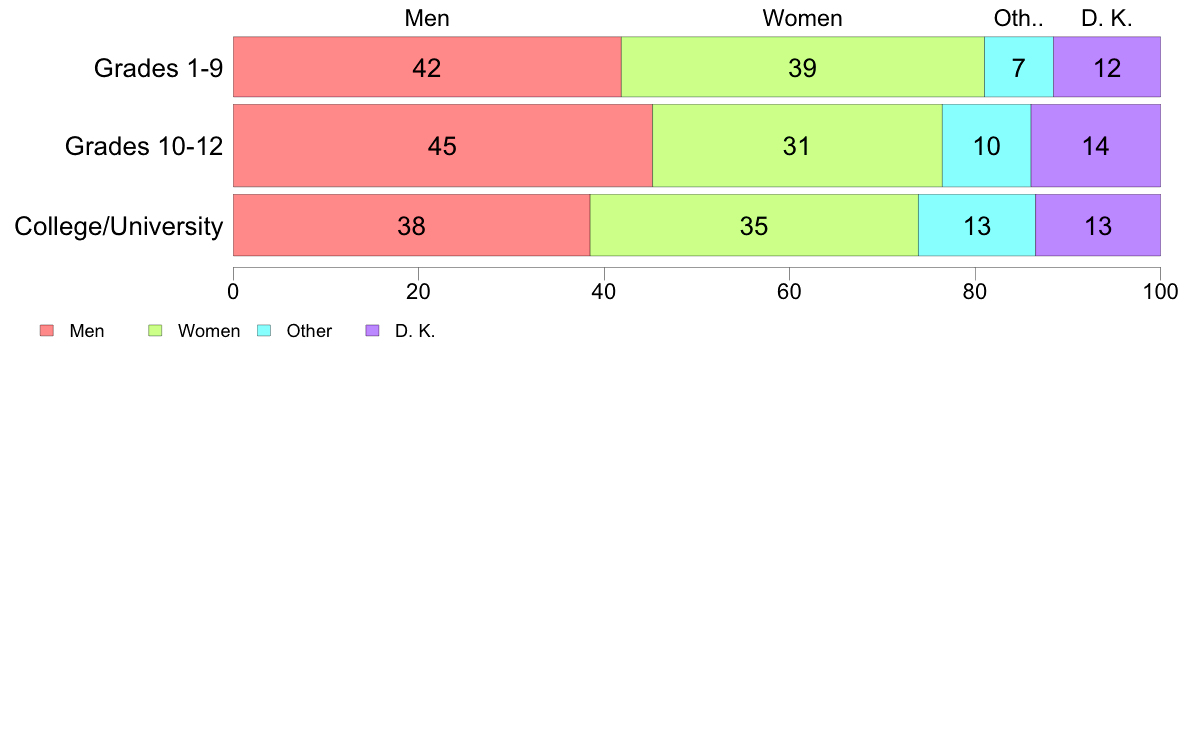
#6.2d Gender with life of pleasure
Then, which do you think gets the greater pleasure out of life, men or women?
| |||||||||||||||||||||||||||||||||||||||||||||||||||||||||||||||||||||||||||||||||||||||||||||||||||||||||||||||||||||||||||||||||||||||||||
| (C) 2017 The Institute of Statistical Mathematics |