Display Style |
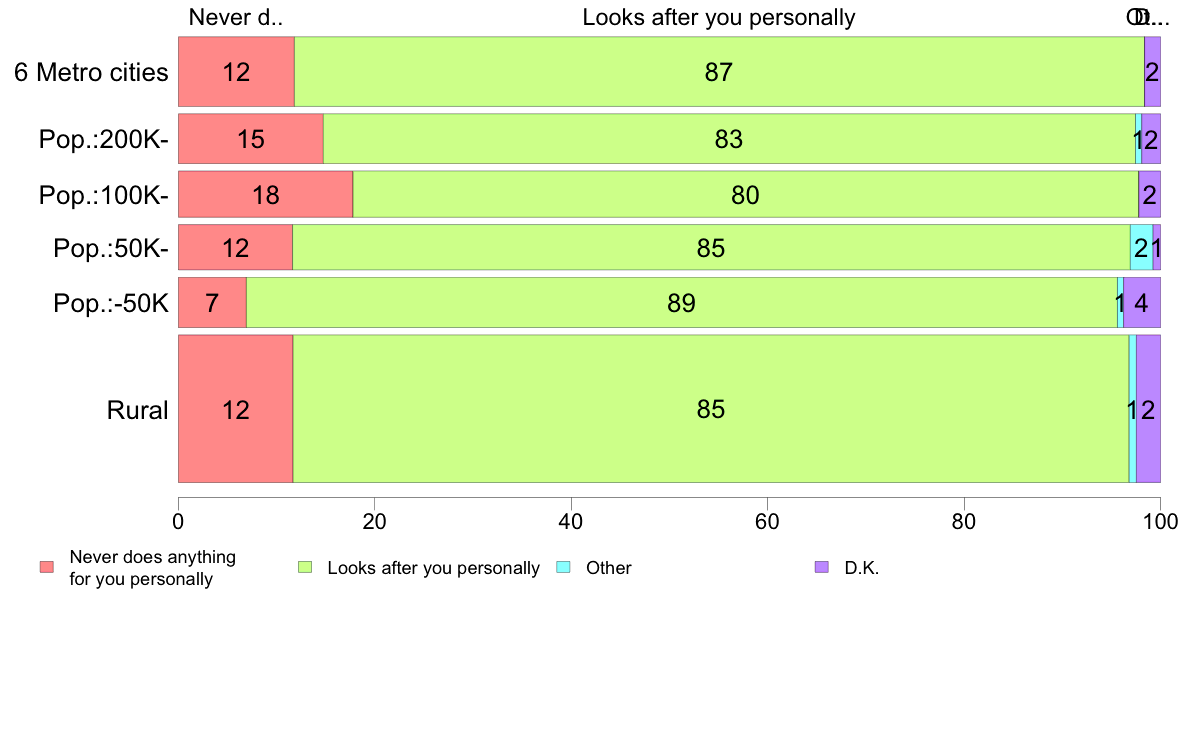
#5.6 Type of boss preferred
Suppose you are working in a firm. Which of the following department chiefs would you prefer to work under? (Hand card)
| |||||||||||||||||||||||||||||||||||||||||||||||||||||||||||||||||||||||||||||||||||||||||||||||||||||||||||||||||||||||||||||||||||||||||||
| (C) 2017 The Institute of Statistical Mathematics |
Display Style |
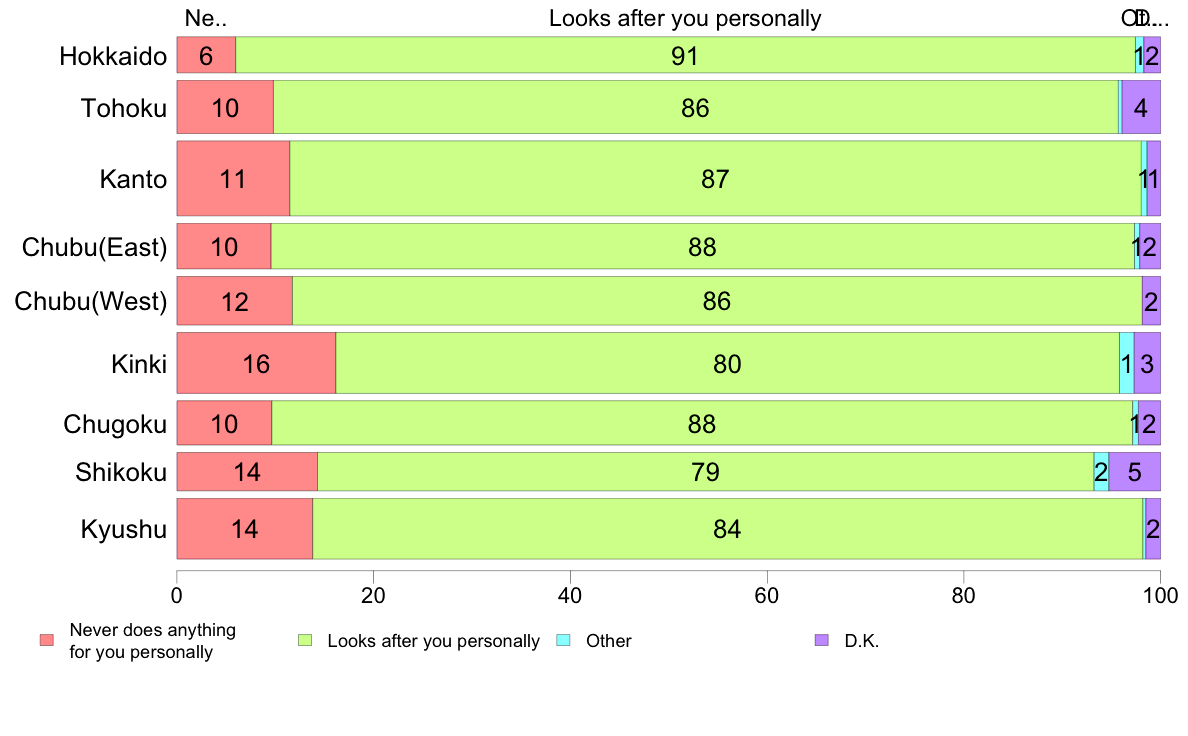
#5.6 Type of boss preferred
Suppose you are working in a firm. Which of the following department chiefs would you prefer to work under? (Hand card)
| |||||||||||||||||||||||||||||||||||||||||||||||||||||||||||||||||||||||||||||||||||||||||||||||||||||||||||||||||||||||||||||||||||||||||||
| (C) 2017 The Institute of Statistical Mathematics |