Display Style |
#3.9 Prime Minister's visit to Ise Shrine
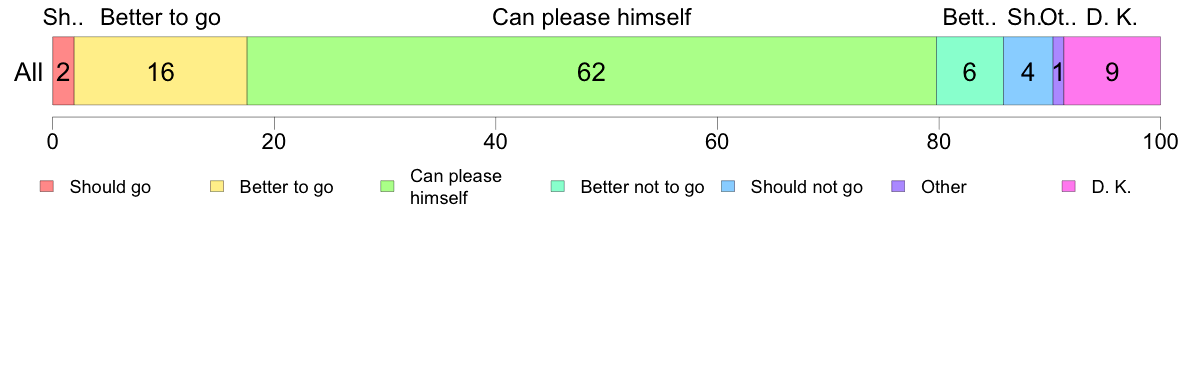
Some Prime Ministers, when they take office, pay a visit to the Imperial Shrine at Ise. What do you think about this practice?
| ||||||||||||||||||||||||||||||||||||||||||||||||||||||||||||||||||||||||||||||||||||||||||||||||||||||||||||||||||||||||||||||||||||||||||||||||||||||||||||||||||||||||||||||||||||||||||||||||||||||||||||||||||||||||||||||||||
| (C) 2017 The Institute of Statistical Mathematics |
Display Style |
#3.9 Prime Minister's visit to Ise Shrine
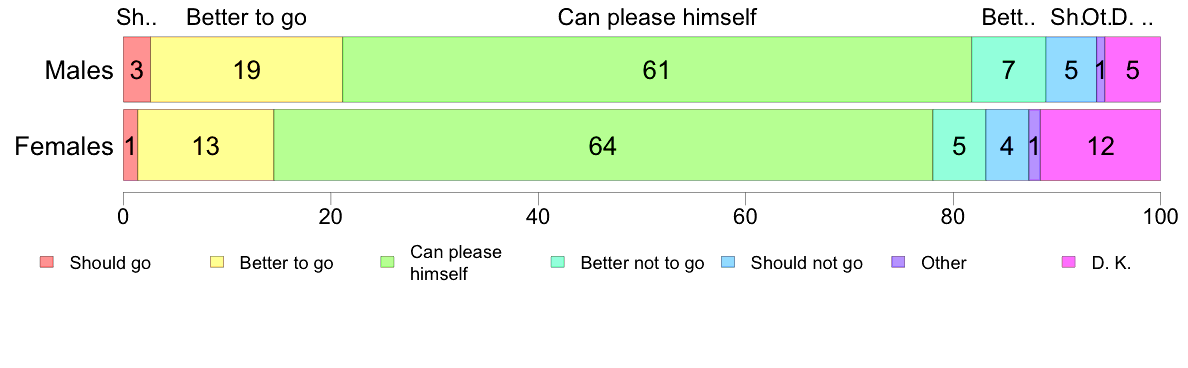
Some Prime Ministers, when they take office, pay a visit to the Imperial Shrine at Ise. What do you think about this practice?
| ||||||||||||||||||||||||||||||||||||||||||||||||||||||||||||||||||||||||||||||||||||||||||||||||||||||||||||||||||||||||||||||||||||||||||||||||||||||||||||||||||||||||||||||||||||||||||||||||||||||||||||||||||||||||||||||||||
| (C) 2017 The Institute of Statistical Mathematics |