Display Style |
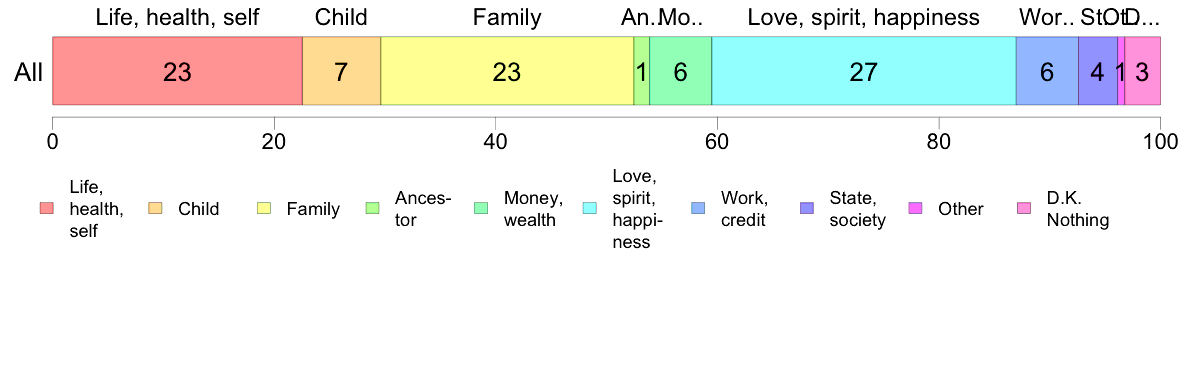
#2.7 The most important thing in life
What is the single most important thing in life for you? Please tell me one thing only. (Anything will do.)
| ||||||||||||||||||||||||||||||||||||||||||||||||||||||||||||||||||||||||||||||||||||||||||||||||||||||||||||||||||||||||||||||||||||||||||||||||||||||||||||||||||||||||||||||||||||||||||||||||||||||||||||||||||||||||||||||||||||||||||||||||||||||||||||||||||||||||||||||||||||||||||||||||||||
| (C) 2017 The Institute of Statistical Mathematics |
Display Style |
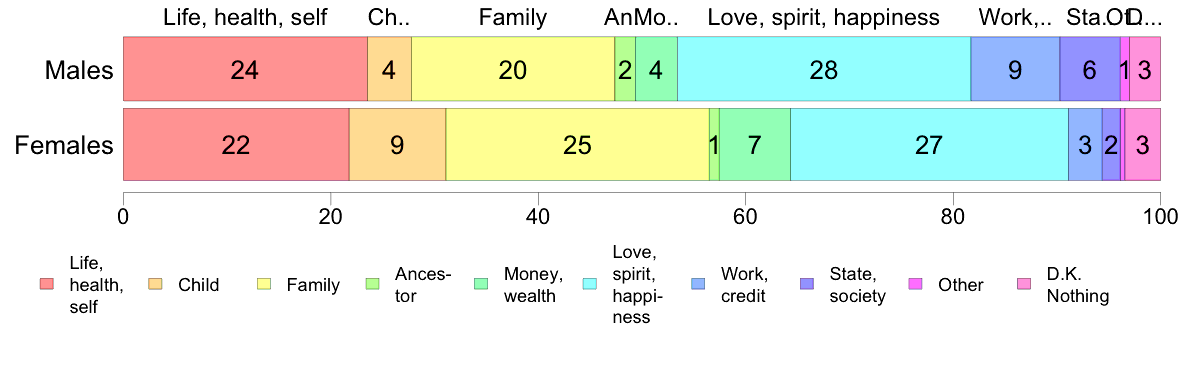
#2.7 The most important thing in life
What is the single most important thing in life for you? Please tell me one thing only. (Anything will do.)
| ||||||||||||||||||||||||||||||||||||||||||||||||||||||||||||||||||||||||||||||||||||||||||||||||||||||||||||||||||||||||||||||||||||||||||||||||||||||||||||||||||||||||||||||||||||||||||||||||||||||||||||||||||||||||||||||||||||||||||||||||||||||||||||||||||||||||||||||||||||||||||||||||||||
| (C) 2017 The Institute of Statistical Mathematics |