Display Style |
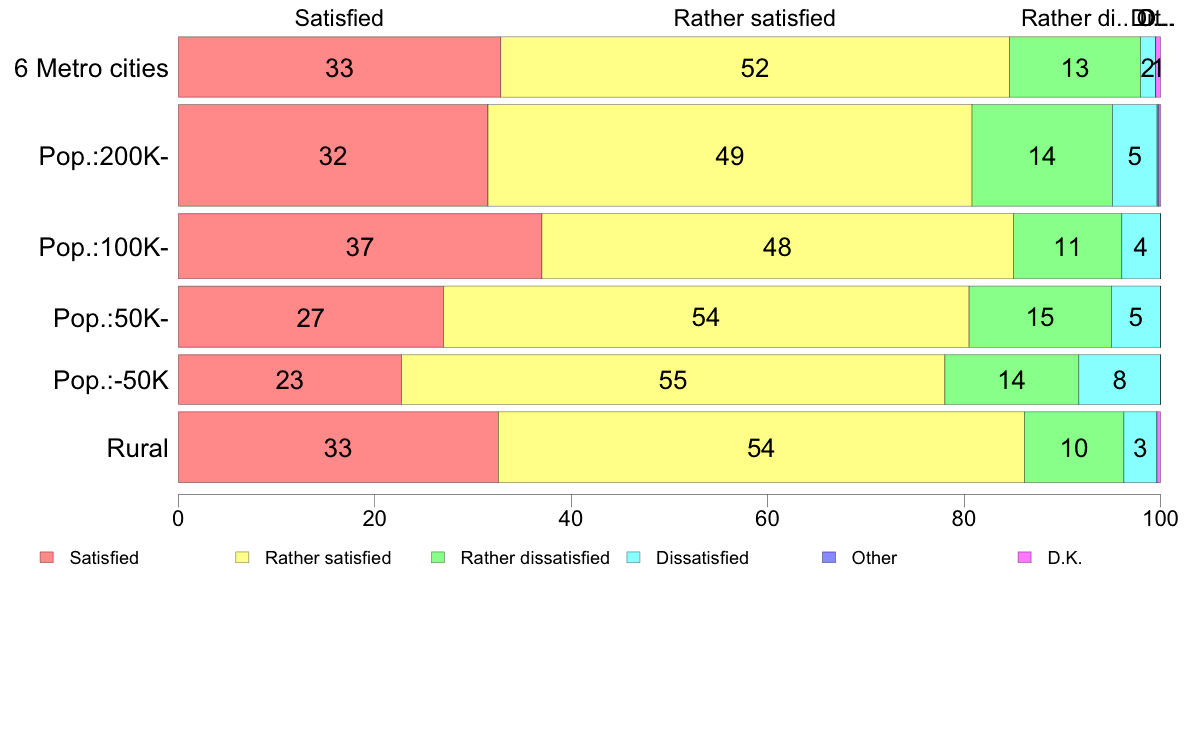
#2.3h Satisfaction with living conditions
(Hand card) Are you satisfied with your living conditions, or dissatisfied?
| |||||||||||||||||||||||||||||||||||||||||||||||||||||||||||||||||||||||||||||||||||||||||||||||||||||||||||||||||||||||||||||||||||||||||||||||||||||||||||||||||||||||||||||||||
| (C) 2017 The Institute of Statistical Mathematics |
Display Style |
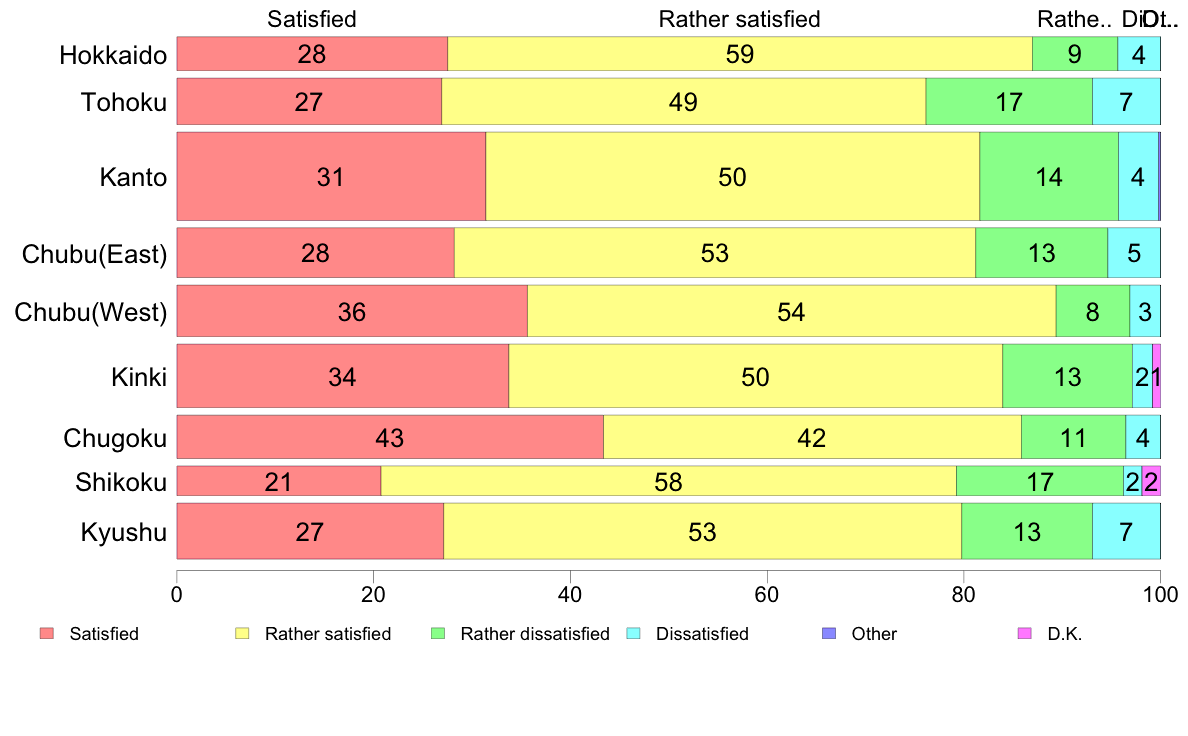
#2.3h Satisfaction with living conditions
(Hand card) Are you satisfied with your living conditions, or dissatisfied?
| |||||||||||||||||||||||||||||||||||||||||||||||||||||||||||||||||||||||||||||||||||||||||||||||||||||||||||||||||||||||||||||||||||||||||||||||||||||||||||||||||||||||||||||||||
| (C) 2017 The Institute of Statistical Mathematics |