Display Style |
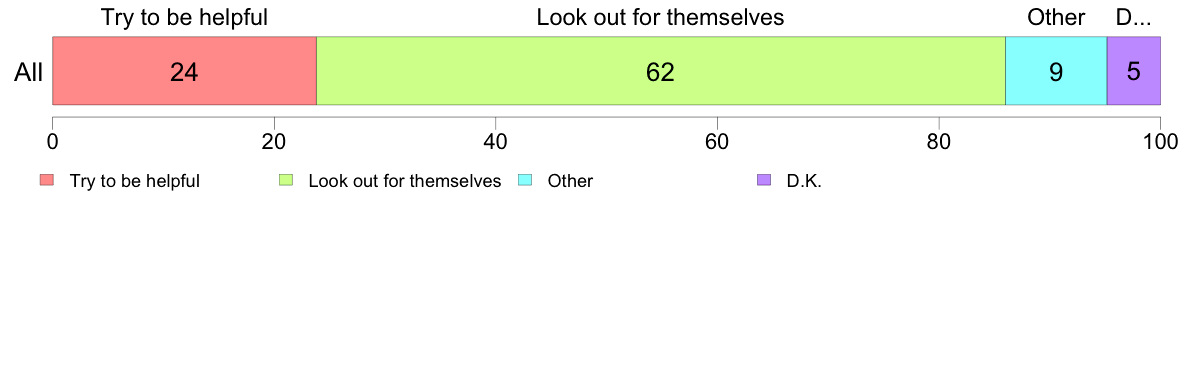
#2.12 Are people helpful to others?
Would you say that most of the time, people try to be helpful, or that they are mostly just looking out for themselves?
| ||||||||||||||||||||||||||||||||||||||||||||||||||||||||||||||||||||||||||||||||||||||||||||||||||||||||||||||||||||||||||||||||||||||||||||||||||||||||||||||||
| (C) 2017 The Institute of Statistical Mathematics |
Display Style |
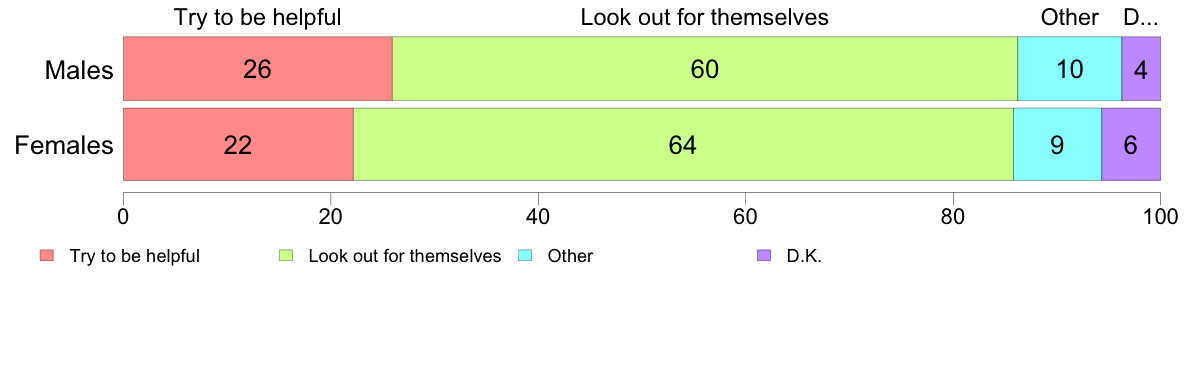
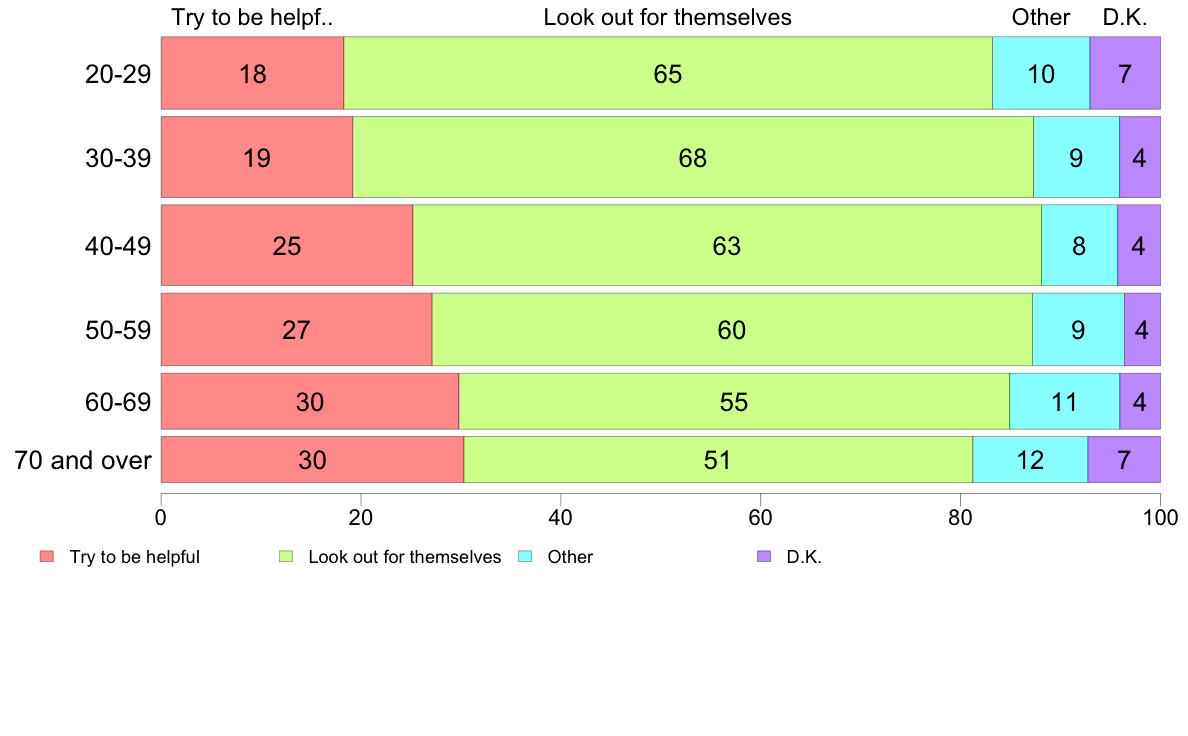
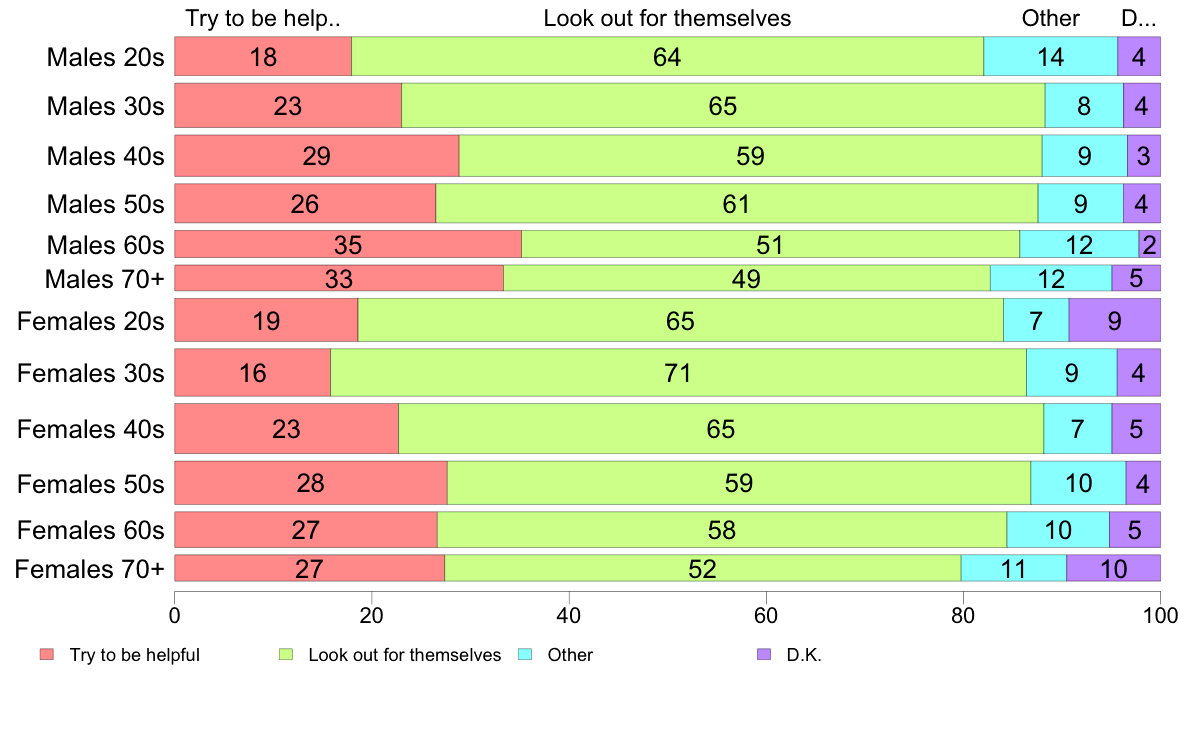
#2.12 Are people helpful to others?
Would you say that most of the time, people try to be helpful, or that they are mostly just looking out for themselves?
| ||||||||||||||||||||||||||||||||||||||||||||||||||||||||||||||||||||||||||||||||||||||||||||||||||||||||||||||||||||||||||||||||||||||||||||||||||||||||||||||||
| (C) 2017 The Institute of Statistical Mathematics |