Display Style |
#1.5 Urban vs. rural
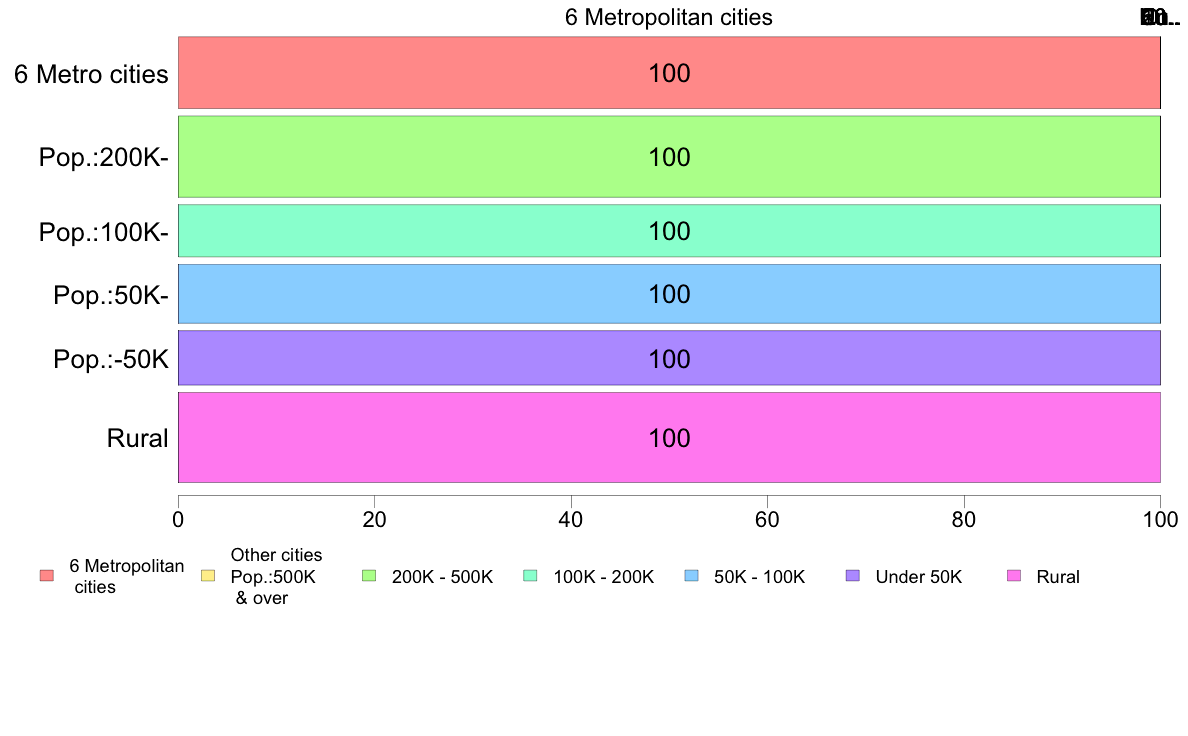
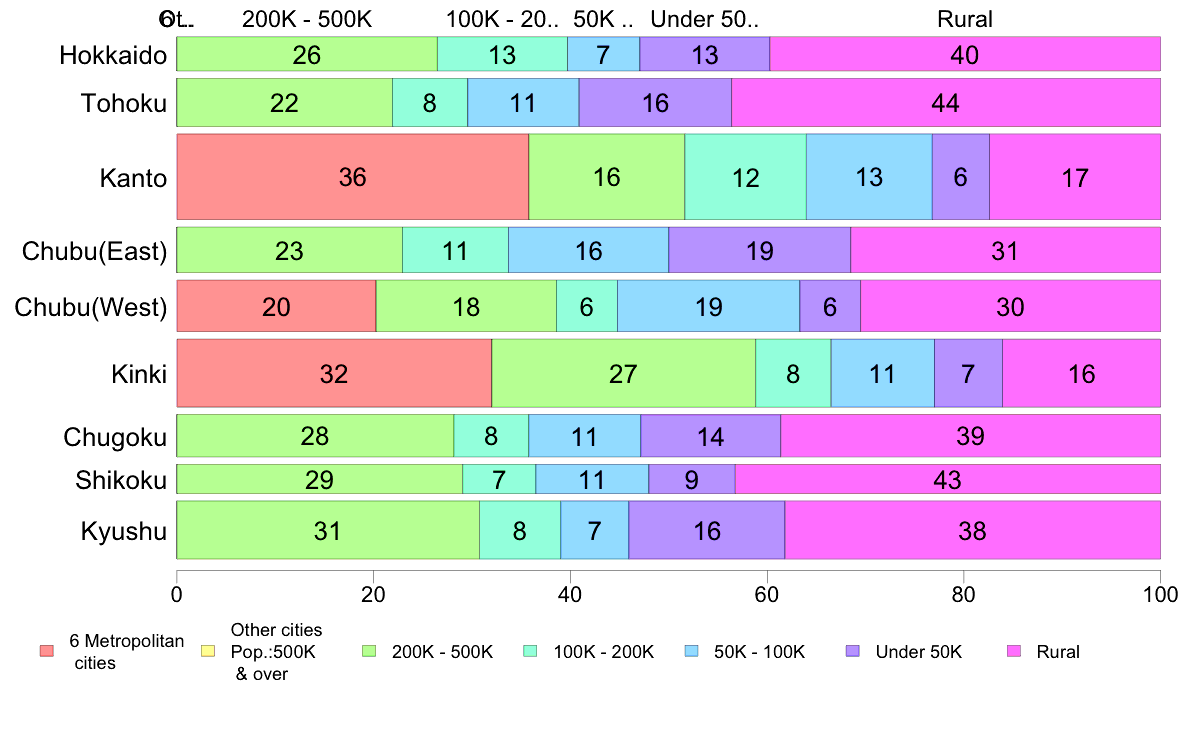
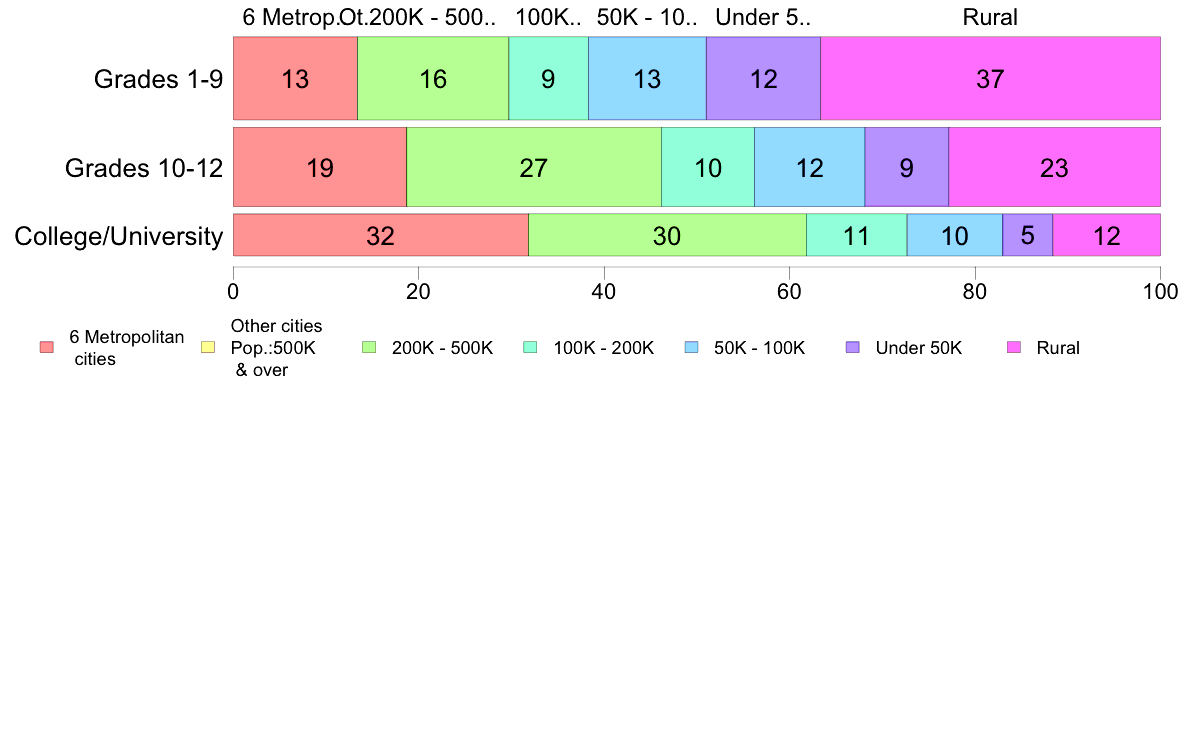
6 Metropolitan cities are Tokyo, Yokohama, Nagoya, Kyoto, Osaka, and Kobe.
| |||||||||||||||||||||||||||||||||||||||||||||||||||||||||||||||||||||||||||||||||||||||||||||||||||||||||||||||||||||||||||||||||||||||||||||||||||||||||||||||||||||||||||||||||
| (C) 2017 The Institute of Statistical Mathematics |
Display Style |
#1.5 Urban vs. rural
6 Metropolitan cities are Tokyo, Yokohama, Nagoya, Kyoto, Osaka, and Kobe.
| |||||||||||||||||||||||||||||||||||||||||||||||||||||||||||||||||||||||||||||||||||||||||||||||||||||||||||||||||||||||||||||||||||||||||||||||||||||||||||||||||||||||||||||||||
| (C) 2017 The Institute of Statistical Mathematics |