Display Style |
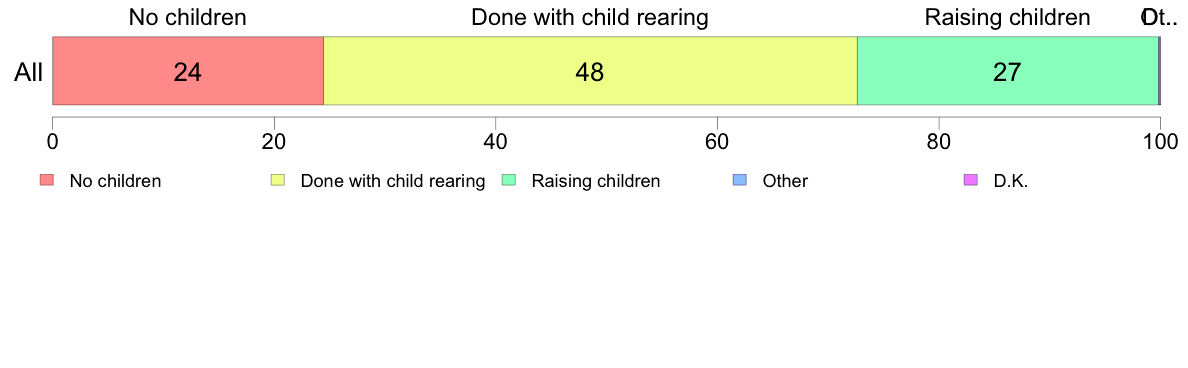
#1.2b2 Children
(Hand card) Do you have children? Which of the following applies to you?
| ||||||||||||||||||||||||||||||||||||||||||||||||||||||||||||||||||||||||||||||||||||||||||||||||||||||||||||||||||||||||||||||||||||||||||||||||||||||||||||||||||||||||||||||||||||||
| (C) 2017 The Institute of Statistical Mathematics |
Display Style |
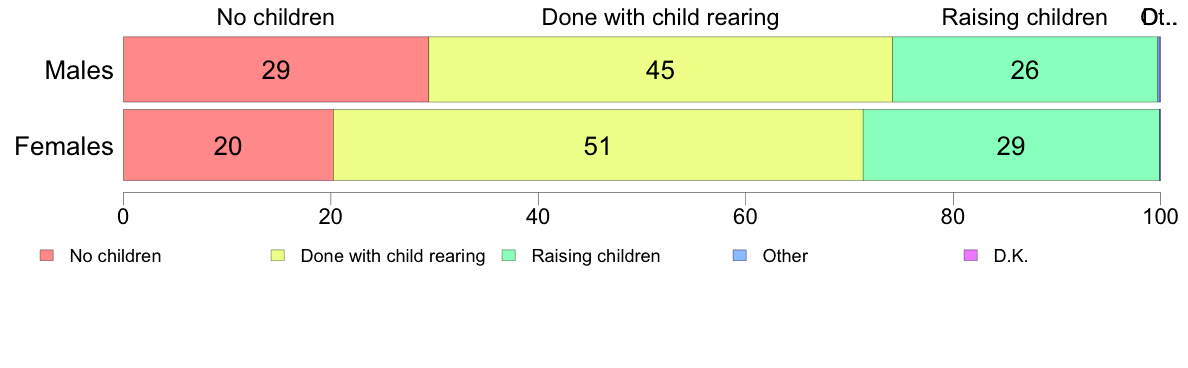
#1.2b2 Children
(Hand card) Do you have children? Which of the following applies to you?
| ||||||||||||||||||||||||||||||||||||||||||||||||||||||||||||||||||||||||||||||||||||||||||||||||||||||||||||||||||||||||||||||||||||||||||||||||||||||||||||||||||||||||||||||||||||||
| (C) 2017 The Institute of Statistical Mathematics |