Outline
Results
Links
Q & As
Display Style
Table
Graph
#1.2 Age
1
Meiji
2
Taisho
Year
Month
3
Showa
Target : X (1998)
Total/Gender/Age
City/Region/Education
20
- 24
25
- 29
30
- 34
35
- 39
40
- 44
45
- 49
50
- 54
55
- 59
60
- 64
65
- 69
70 yrs
& over
Total
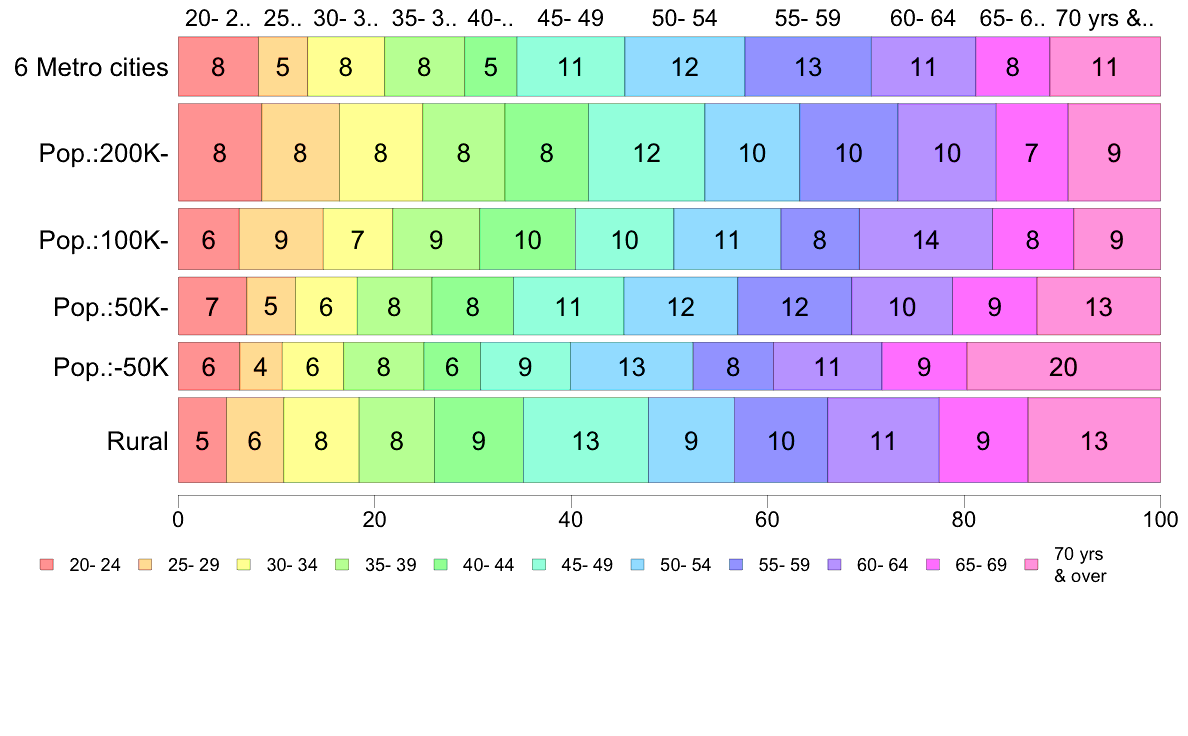
6 Metro cities
8
5
8
8
5
11
12
13
11
8
11
100
( 319)
Pop.:200K-
8
8
8
8
8
12
10
10
10
7
9
98
( 860)
Pop.:100K-
6
9
7
9
10
10
11
8
14
8
9
101
( 339)
Pop.:50K-
7
5
6
8
8
11
12
12
10
9
13
101
( 302)
Pop.:-50K
6
4
6
8
6
9
13
8
11
9
20
100
( 208)
Rural
5
6
8
8
9
13
9
10
11
9
13
101
( 652)
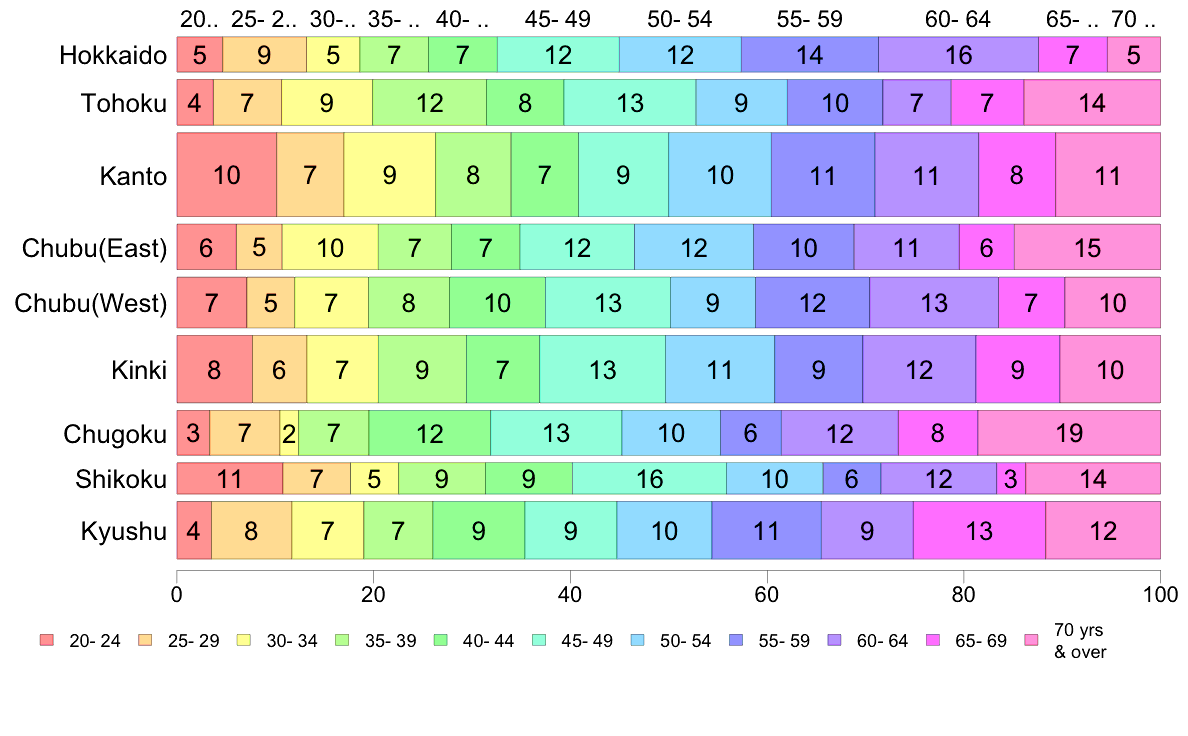
Hokkaido
5
9
5
7
7
12
12
14
16
7
5
99
( 129)
Tohoku
4
7
9
12
8
13
9
10
7
7
14
100
( 216)
Kanto
10
7
9
8
7
9
10
11
11
8
11
101
( 730)
Chubu(East)
6
5
10
7
7
12
12
10
11
6
15
101
( 215)
Chubu(West)
7
5
7
8
10
13
9
12
13
7
10
101
( 267)
Kinki
8
6
7
9
7
13
11
9
12
9
10
101
( 469)
Chugoku
3
7
2
7
12
13
10
6
12
8
19
99
( 210)
Shikoku
11
7
5
9
9
16
10
6
12
3
14
102
( 102)
Kyushu
4
8
7
7
9
9
10
11
9
13
12
99
( 342)
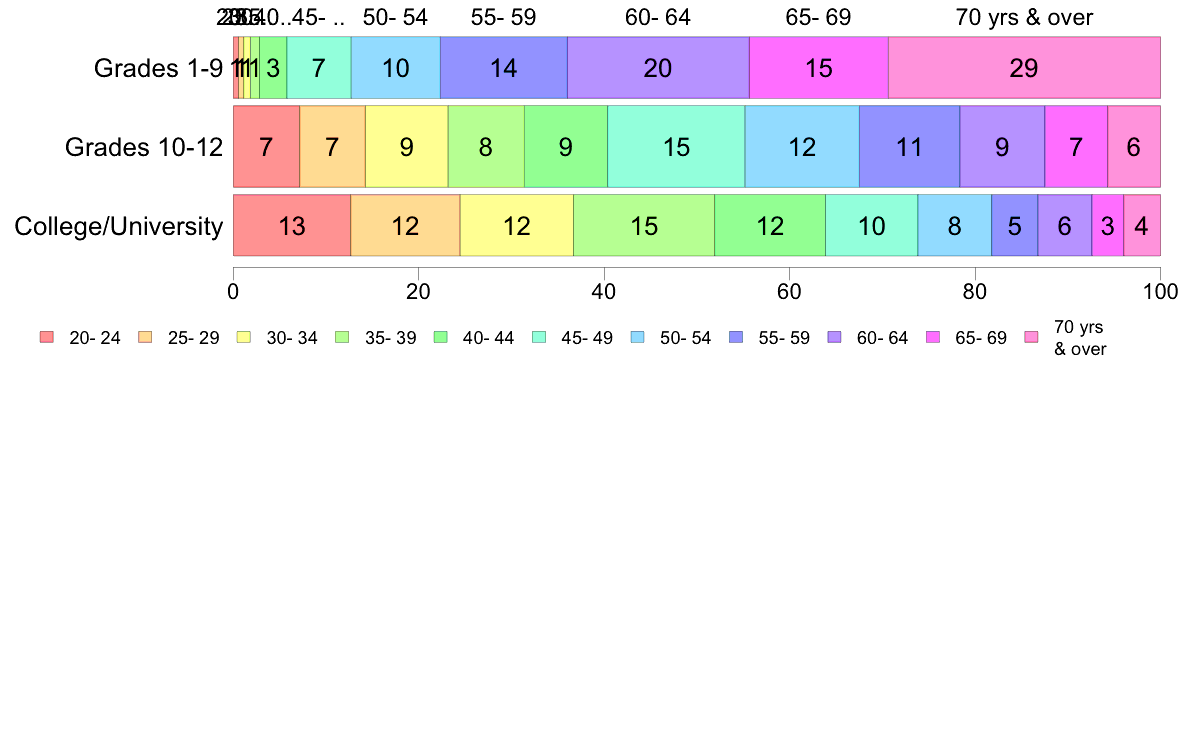
Grades 1-9
1
1
1
1
3
7
10
14
20
15
29
102
( 708)
Grades 10-12
7
7
9
8
9
15
12
11
9
7
6
100
(1,243)
College/University
13
12
12
15
12
10
8
5
6
3
4
100
( 703)
(C) 2017 The Institute of Statistical Mathematics