Outline
Results
Links
Q & As
Display Style
Table
Graph
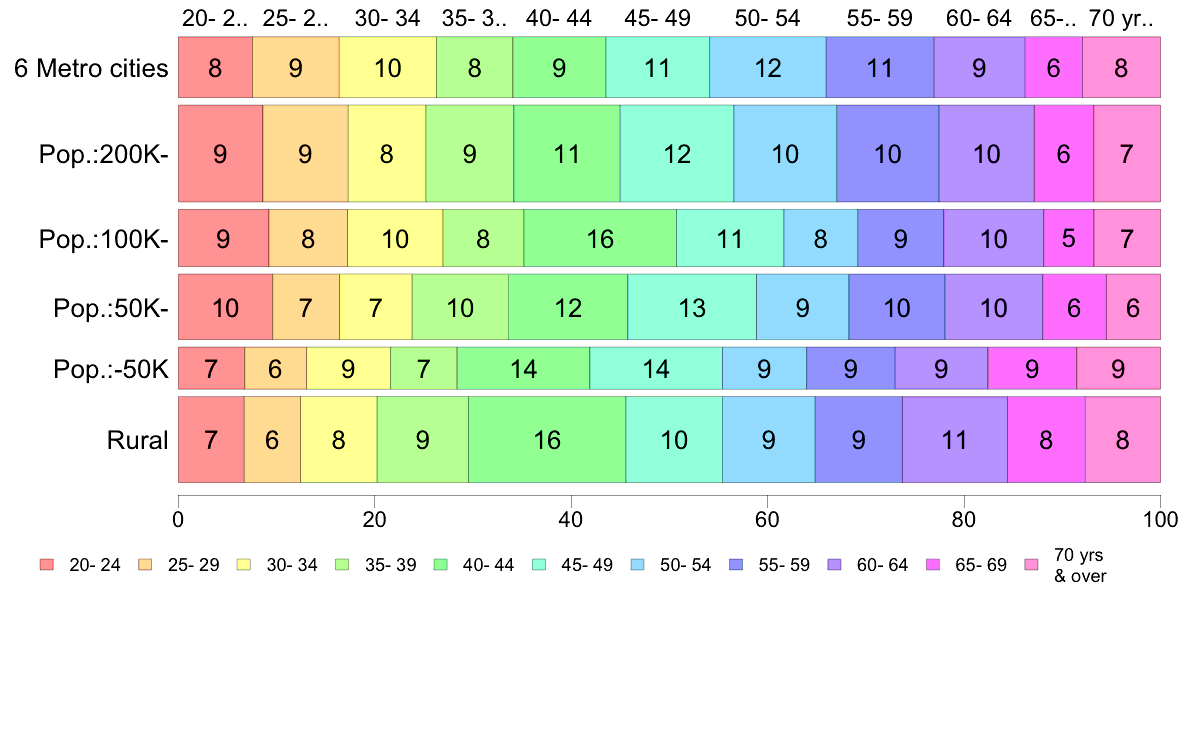
#1.2 Age
1
Meiji
2
Taisho
Year
Month
3
Showa
Target : IX (1993)
Total/Gender/Age
City/Region/Education
20
- 24
25
- 29
30
- 34
35
- 39
40
- 44
45
- 49
50
- 54
55
- 59
60
- 64
65
- 69
70 yrs
& over
Total
6 Metro cities
8
9
10
8
9
11
12
11
9
6
8
101
( 464)
Pop.:200K-
9
9
8
9
11
12
10
10
10
6
7
101
(1,174)
Pop.:100K-
9
8
10
8
16
11
8
9
10
5
7
101
( 412)
Pop.:50K-
10
7
7
10
12
13
9
10
10
6
6
100
( 542)
Pop.:-50K
7
6
9
7
14
14
9
9
9
9
9
102
( 222)
Rural
7
6
8
9
16
10
9
9
11
8
8
101
( 924)
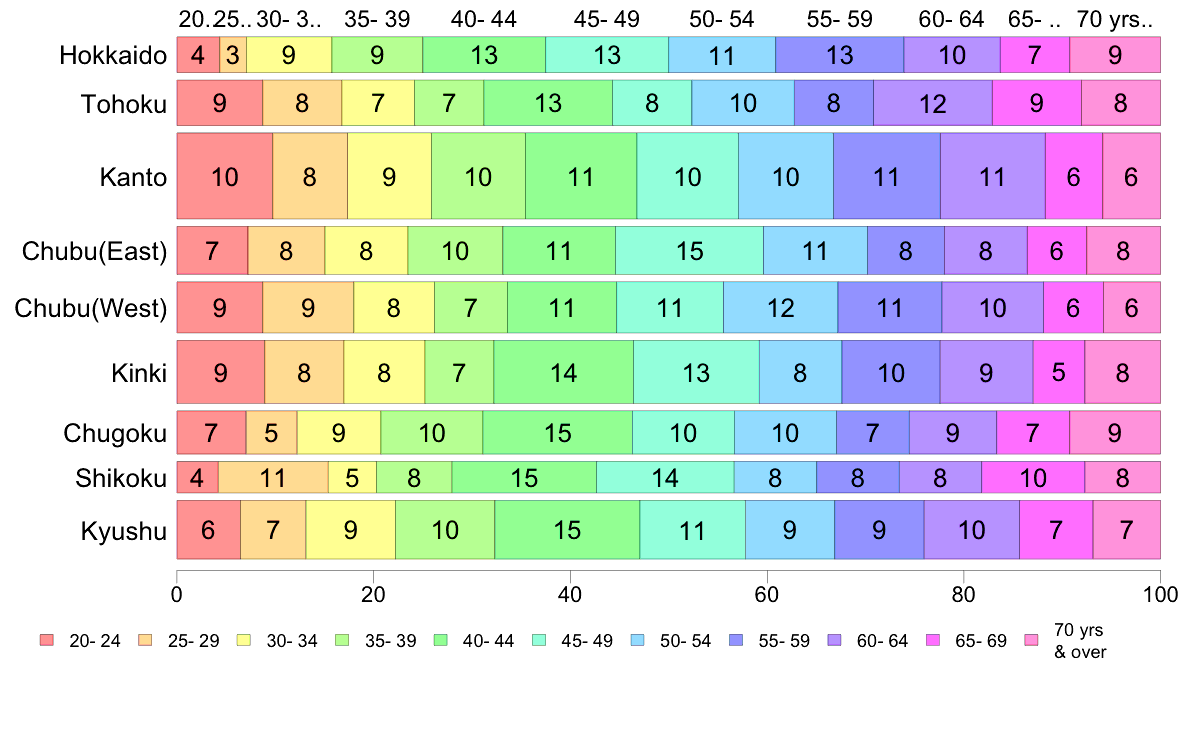
Hokkaido
4
3
9
9
13
13
11
13
10
7
9
101
( 184)
Tohoku
9
8
7
7
13
8
10
8
12
9
8
99
( 298)
Kanto
10
8
9
10
11
10
10
11
11
6
6
102
(1,067)
Chubu(East)
7
8
8
10
11
15
11
8
8
6
8
100
( 332)
Chubu(West)
9
9
8
7
11
11
12
11
10
6
6
100
( 378)
Kinki
9
8
8
7
14
13
8
10
9
5
8
99
( 571)
Chugoku
7
5
9
10
15
10
10
7
9
7
9
98
( 270)
Shikoku
4
11
5
8
15
14
8
8
8
10
8
99
( 143)
Kyushu
6
7
9
10
15
11
9
9
10
7
7
100
( 495)
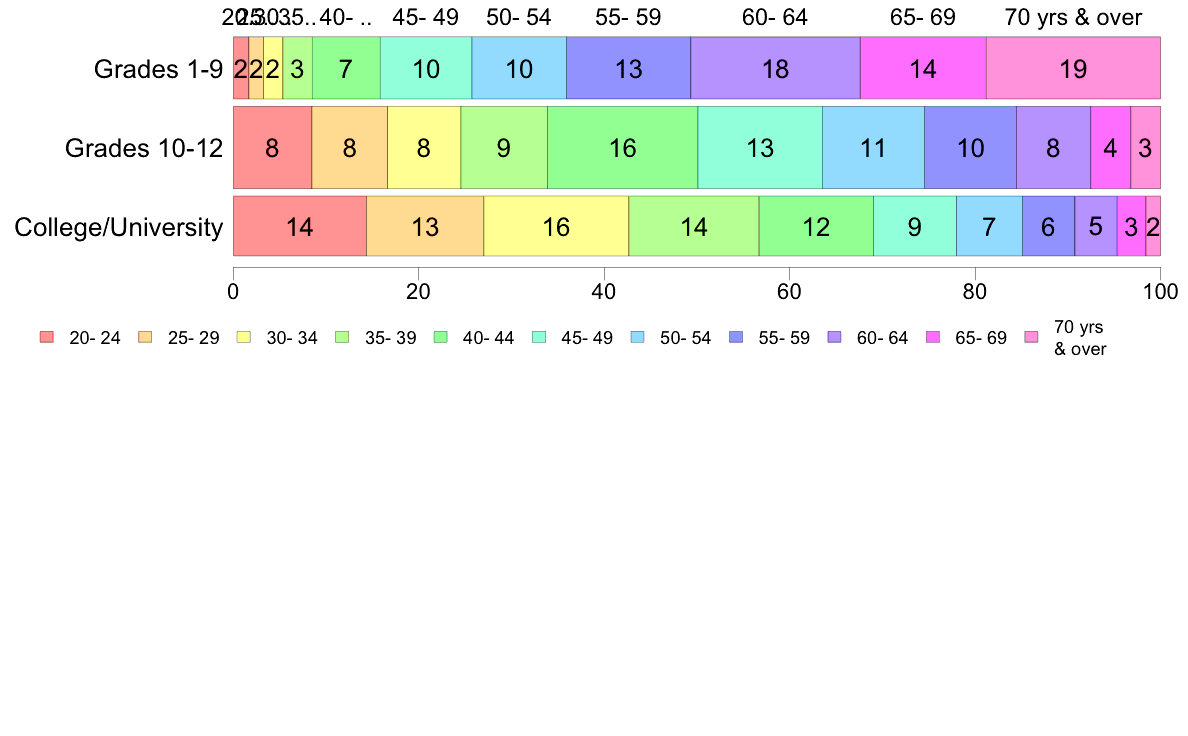
Grades 1-9
2
2
2
3
7
10
10
13
18
14
19
100
(1,010)
Grades 10-12
8
8
8
9
16
13
11
10
8
4
3
98
(1,768)
College/University
14
13
16
14
12
9
7
6
5
3
2
101
( 940)
(C) 2017 The Institute of Statistical Mathematics