Outline
Results
Links
Q & As
Display Style
Table
Graph
#1.2 Age
[
Age
]
1
Yes
2
No Meiji, Taisho, Showa Year Month
Target : IV (1968)
Total/Gender/Age
City/Region/Education
20
- 24
25
- 29
30
- 34
35
- 39
40
- 44
45
- 49
50
- 54
55
- 59
60
- 64
65
- 69
70 yrs
& over
Total
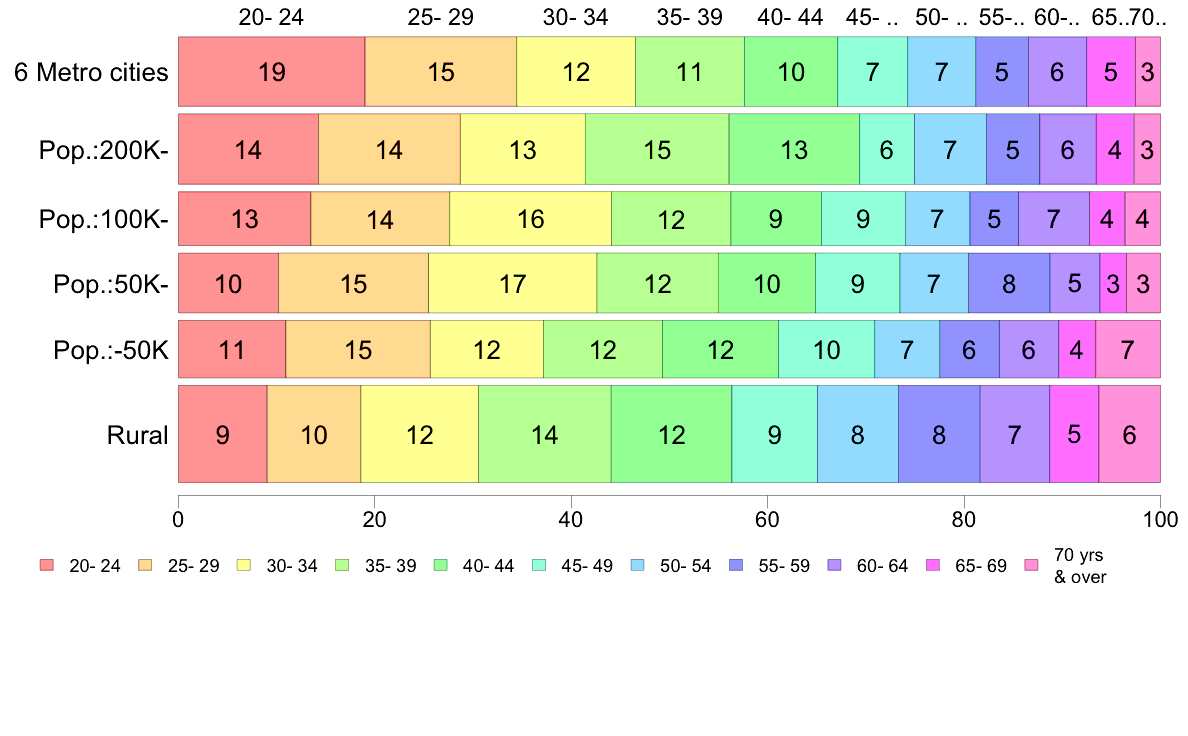
6 Metro cities
19
15
12
11
10
7
7
5
6
5
3
100
( 505)
Pop.:200K-
14
14
13
15
13
6
7
5
6
4
3
100
( 519)
Pop.:100K-
13
14
16
12
9
9
7
5
7
4
4
100
( 304)
Pop.:50K-
10
15
17
12
10
9
7
8
5
3
3
99
( 373)
Pop.:-50K
11
15
12
12
12
10
7
6
6
4
7
102
( 347)
Rural
9
10
12
14
12
9
8
8
7
5
6
100
( 985)
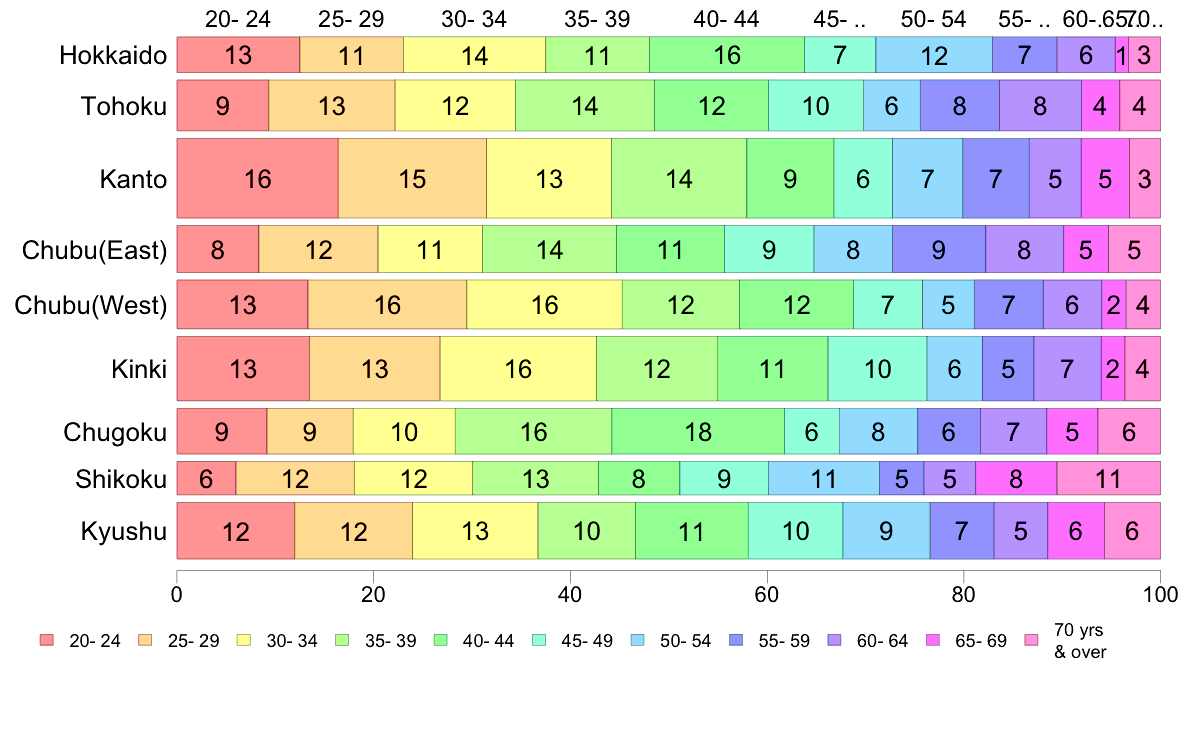
Hokkaido
13
11
14
11
16
7
12
7
6
1
3
101
( 152)
Tohoku
9
13
12
14
12
10
6
8
8
4
4
100
( 311)
Kanto
16
15
13
14
9
6
7
7
5
5
3
100
( 756)
Chubu(East)
8
12
11
14
11
9
8
9
8
5
5
100
( 264)
Chubu(West)
13
16
16
12
12
7
5
7
6
2
4
100
( 285)
Kinki
13
13
16
12
11
10
6
5
7
2
4
99
( 497)
Chugoku
9
9
10
16
18
6
8
6
7
5
6
100
( 251)
Shikoku
6
12
12
13
8
9
11
5
5
8
11
100
( 133)
Kyushu
12
12
13
10
11
10
9
7
5
6
6
101
( 384)
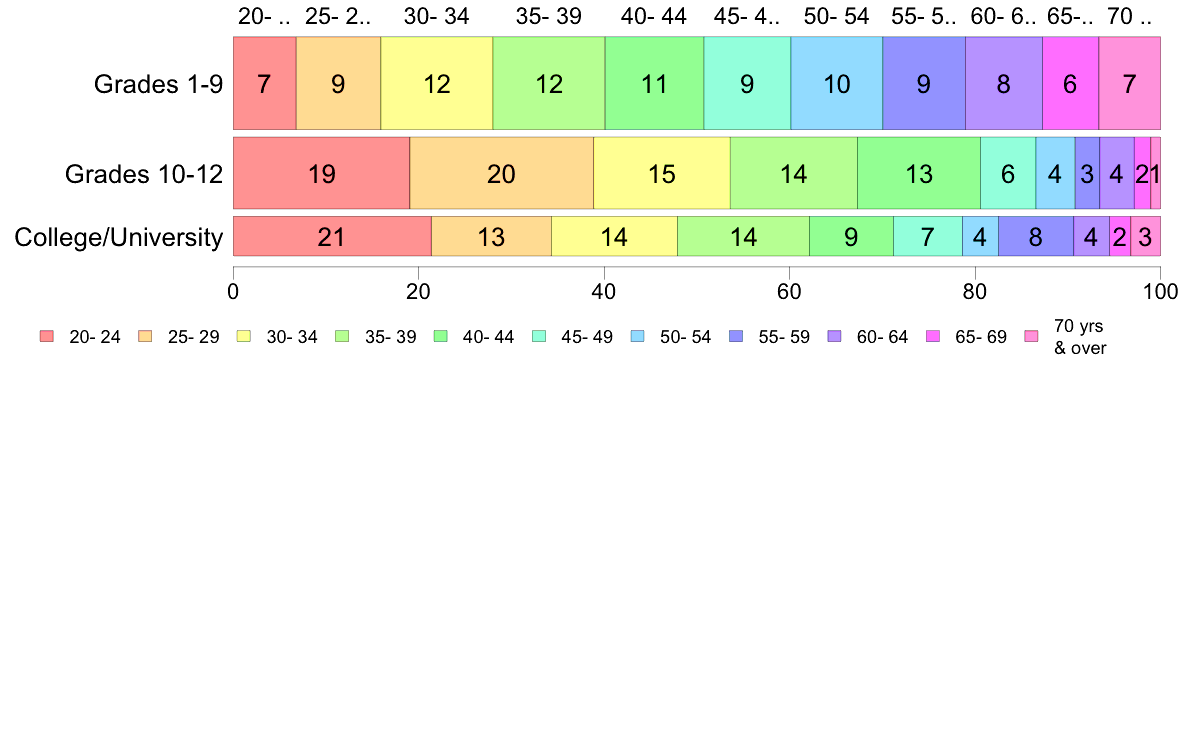
Grades 1-9
7
9
12
12
11
9
10
9
8
6
7
100
(1,696)
Grades 10-12
19
20
15
14
13
6
4
3
4
2
1
101
(1,019)
College/University
21
13
14
14
9
7
4
8
4
2
3
99
( 309)
(C) 2017 The Institute of Statistical Mathematics