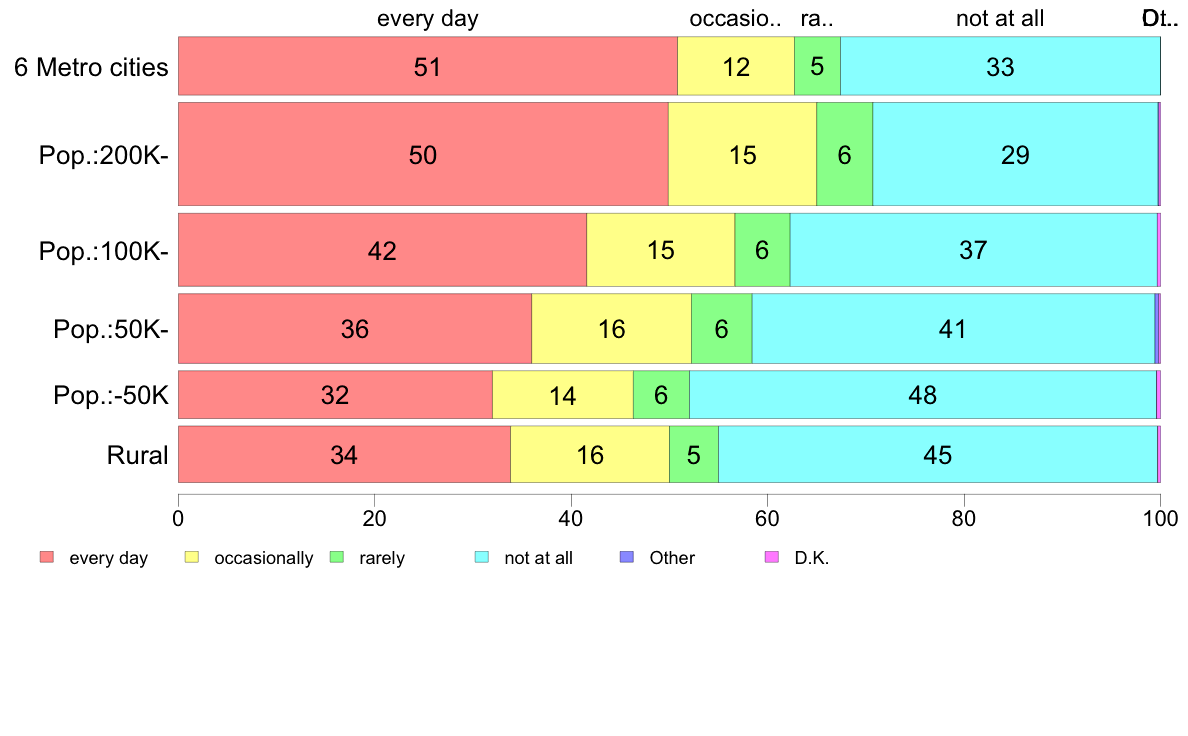
Display Style |
#1.11b Frequency of internet usage
(Hand card) Do you use the Internet to read web pages or to check your email? This may be either work-related or for personal use.
| |||||||||||||||||||||||||||||||||||||||||||||||||||||||||||||||||||||||||||||||||||||||||||||||||||||||||||||||||||||||||||||||||||||||||||||||||||||||||||||||||||||||||||||||||
| (C) 2017 The Institute of Statistical Mathematics |
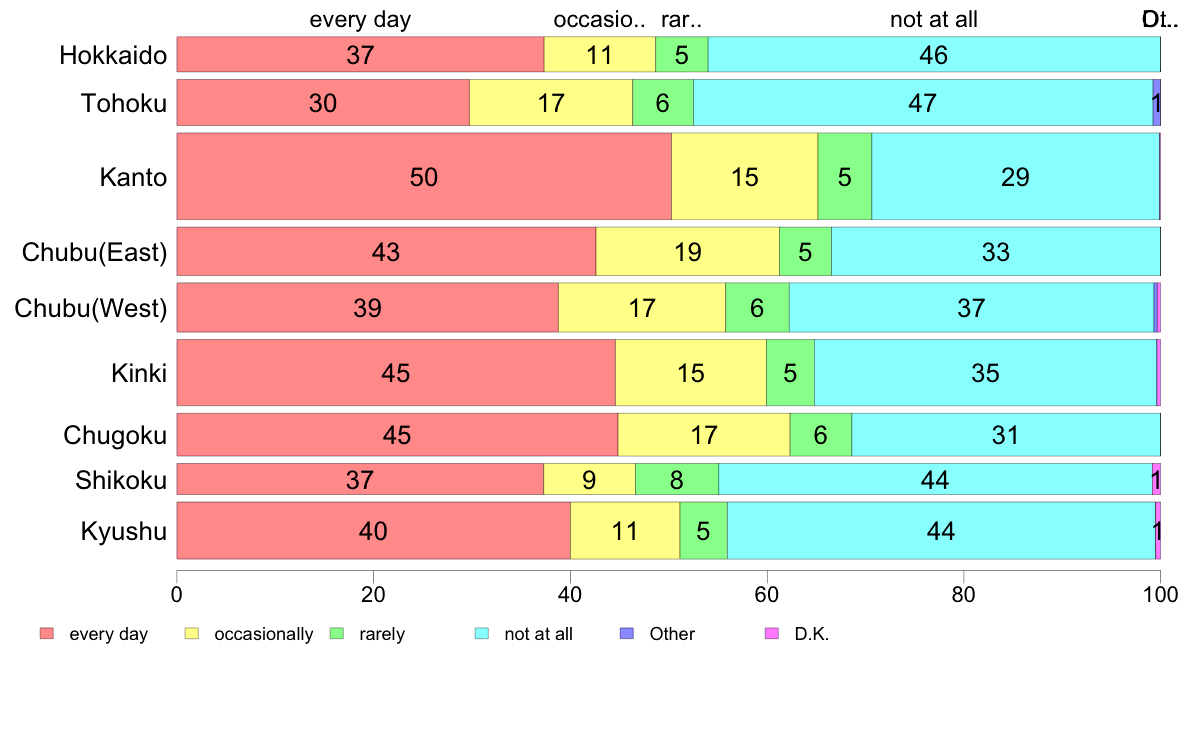