Outline
Results
Links
Q & As
Display Style
Table
Graph
#1.1 Gender
Gender
1
Male
2
Female
Target : XI (2003)
Total/Gender/Age
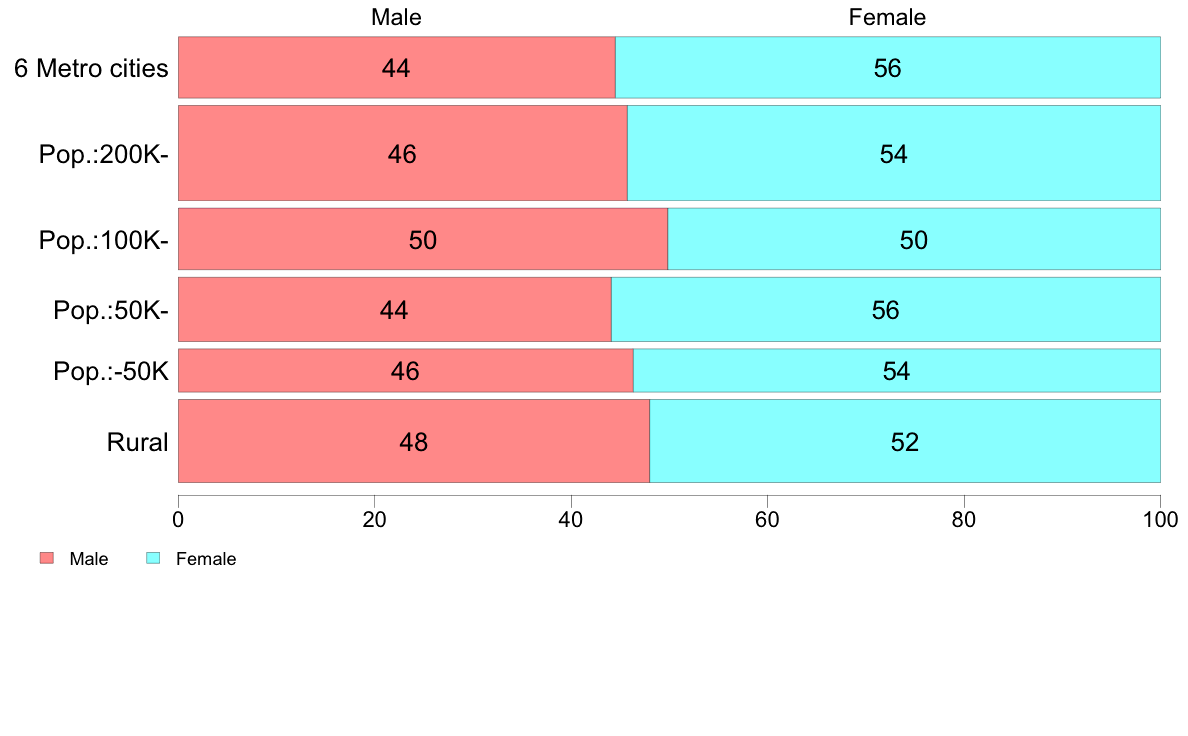
City/Region/Education
Male
Female
Total
6 Metro cities
44
56
100
( 299)
Pop.:200K-
46
54
100
( 722)
Pop.:100K-
50
50
100
( 303)
Pop.:50K-
44
56
100
( 329)
Pop.:-50K
46
54
100
( 149)
Rural
48
52
100
( 548)
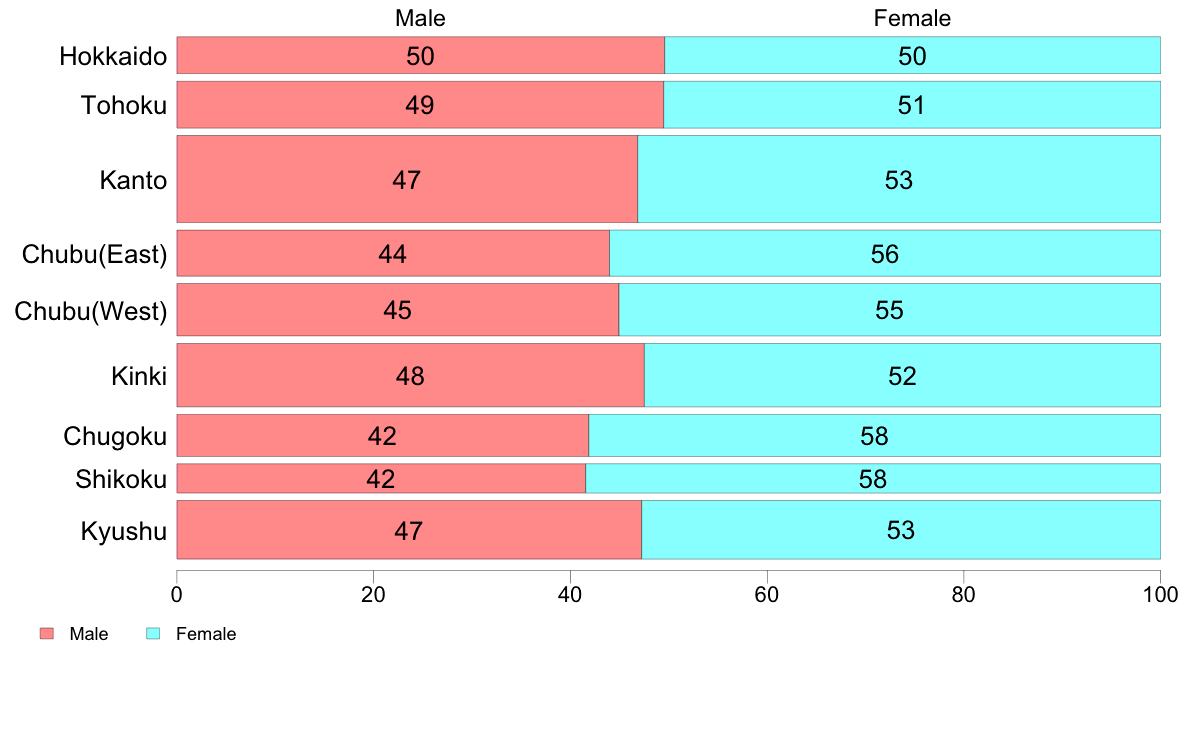
Hokkaido
50
50
100
( 123)
Tohoku
49
51
100
( 198)
Kanto
47
53
100
( 683)
Chubu(East)
44
56
100
( 191)
Chubu(West)
45
55
100
( 247)
Kinki
48
52
100
( 362)
Chugoku
42
58
100
( 160)
Shikoku
42
58
100
( 77)
Kyushu
47
53
100
( 309)
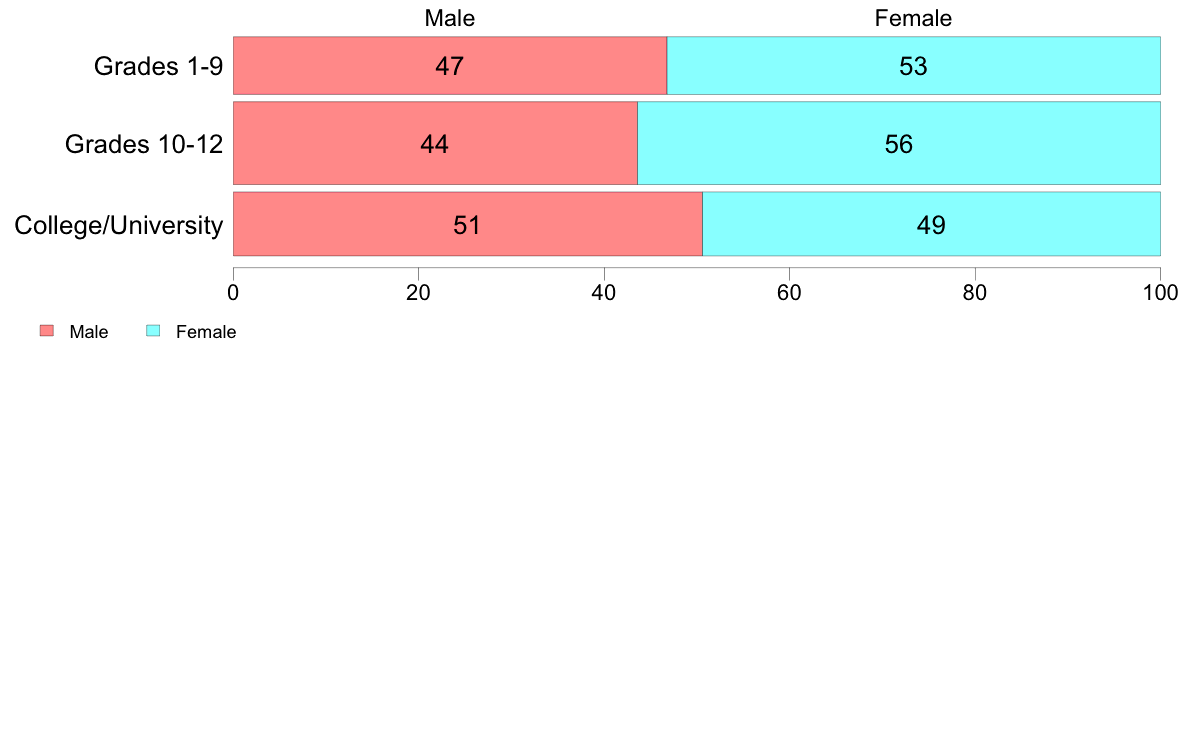
Grades 1-9
47
53
100
( 543)
Grades 10-12
44
56
100
(1,124)
College/University
51
49
100
( 672)
(C) 2017 The Institute of Statistical Mathematics