Outline
Results
Links
Q & As
Display Style
Table
Graph
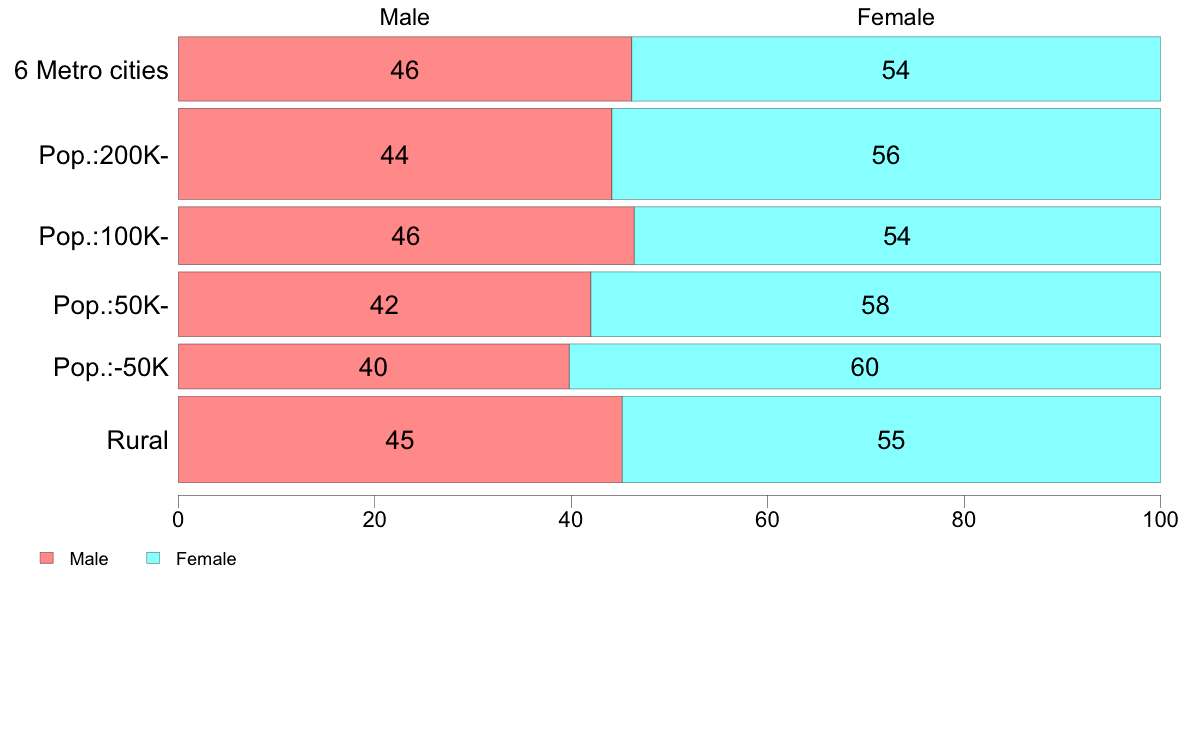
#1.1 Gender
[Gender]
1
Male
2
Female
Target : VII (1983)
Total/Gender/Age
City/Region/Education
Male
Female
Total
6 Metro cities
46
54
100
( 624)
Pop.:200K-
44
56
100
(1,246)
Pop.:100K-
46
54
100
( 502)
Pop.:50K-
42
58
100
( 631)
Pop.:-50K
40
60
100
( 304)
Rural
45
55
100
(1,122)
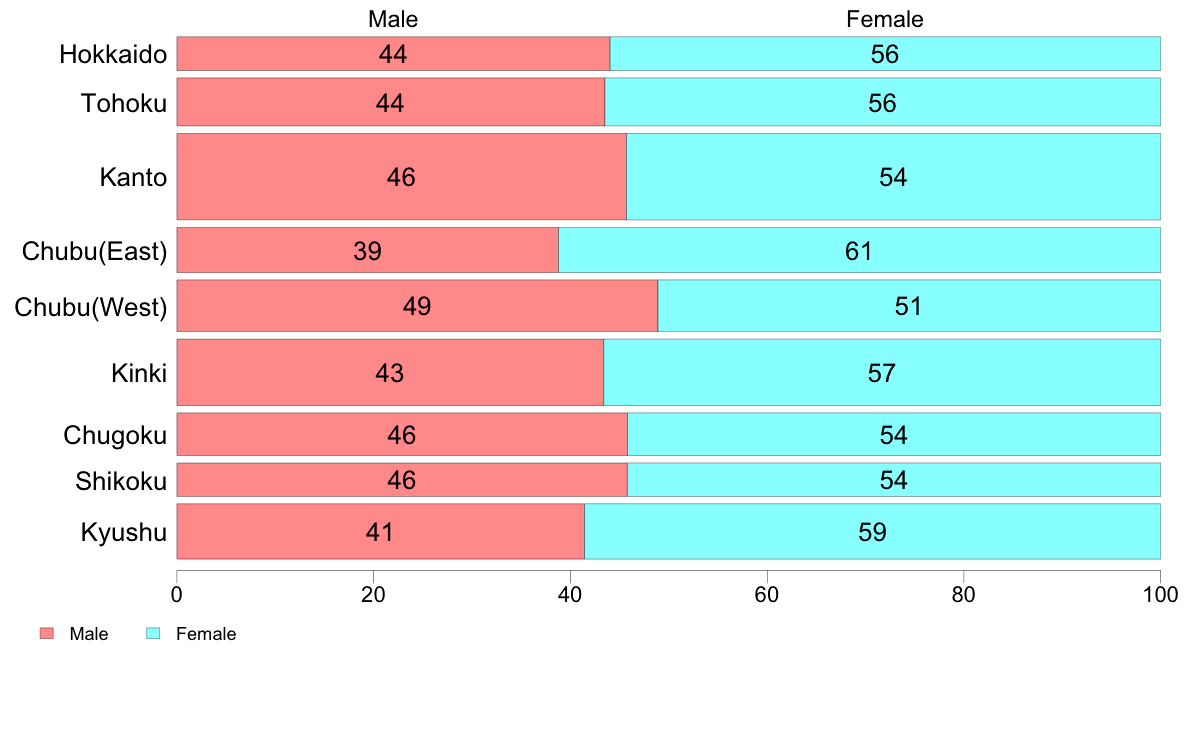
Hokkaido
44
56
100
( 193)
Tohoku
44
56
100
( 393)
Kanto
46
54
100
(1,271)
Chubu(East)
39
61
100
( 348)
Chubu(West)
49
51
100
( 456)
Kinki
43
57
100
( 749)
Chugoku
46
54
100
( 310)
Shikoku
46
54
100
( 190)
Kyushu
41
59
100
( 519)
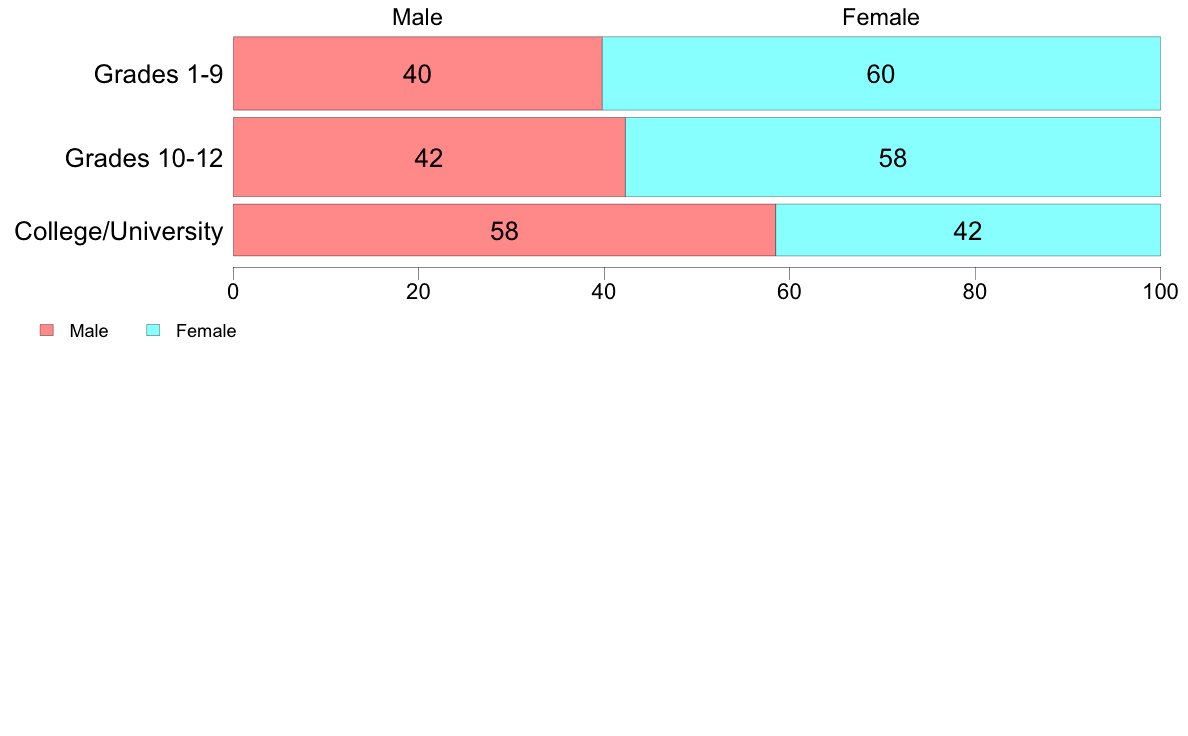
Grades 1-9
40
60
100
(1,644)
Grades 10-12
42
58
100
(1,923)
College/University
58
42
100
( 824)
(C) 2017 The Institute of Statistical Mathematics