Outline
Results
Links
Q & As
Display Style
Table
Graph
#1.1 Gender
[
Gender
]
Male
Female
Target : III (1963)
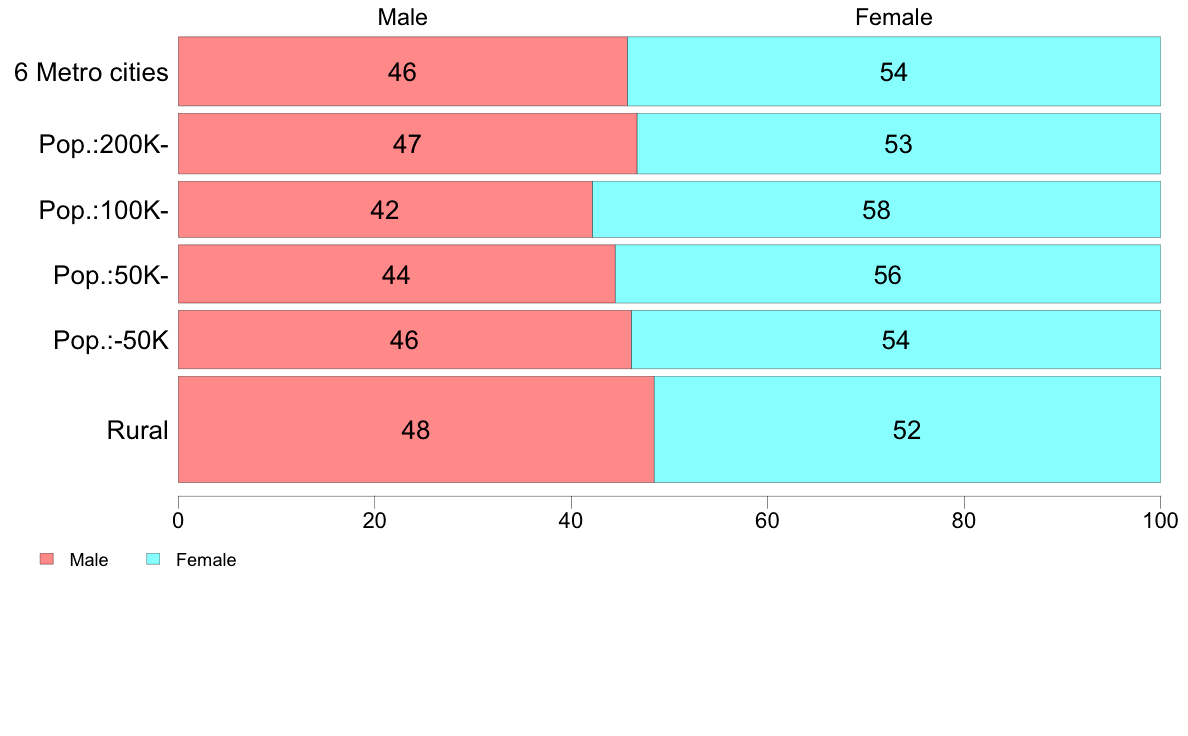
Total/Gender/Age
City/Region/Education
Male
Female
Total
6 Metro cities
46
54
100
( 433)
Pop.:200K-
47
53
100
( 334)
Pop.:100K-
42
58
100
( 287)
Pop.:50K-
44
56
100
( 308)
Pop.:-50K
46
54
100
( 310)
Rural
48
52
100
(1,026)
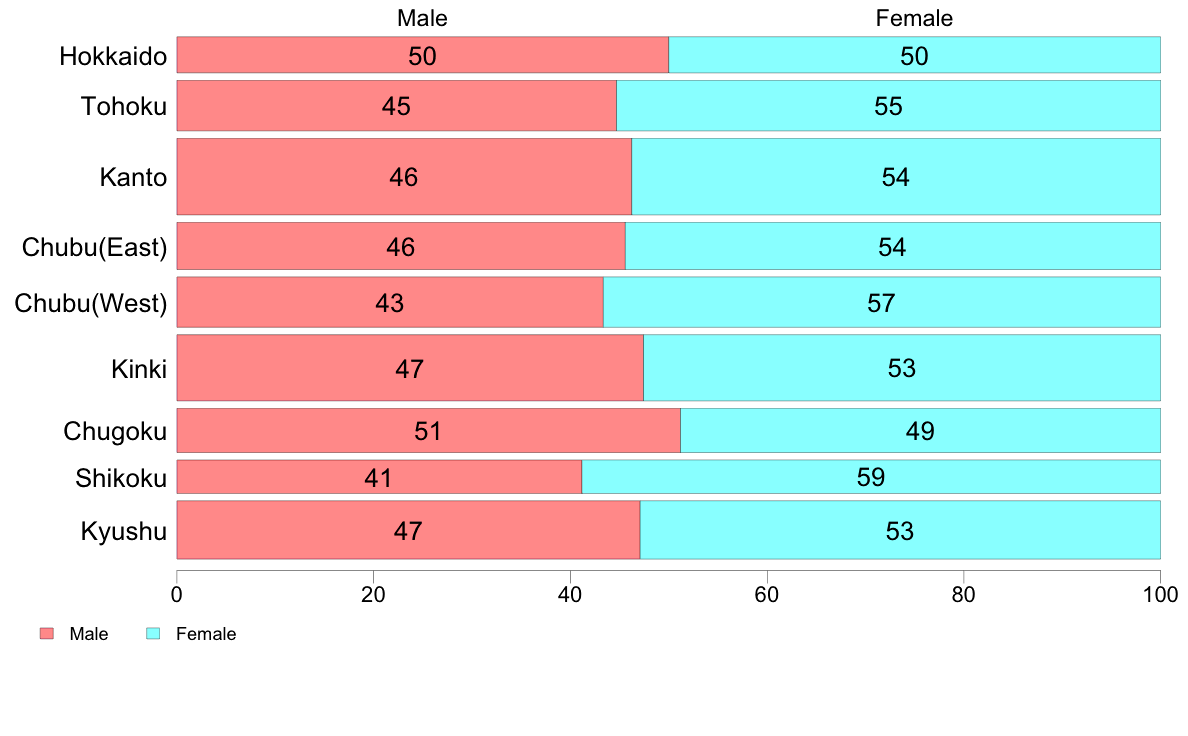
Hokkaido
50
50
100
( 138)
Tohoku
45
55
100
( 273)
Kanto
46
54
100
( 625)
Chubu(East)
46
54
100
( 237)
Chubu(West)
43
57
100
( 270)
Kinki
47
53
100
( 466)
Chugoku
51
49
100
( 209)
Shikoku
41
59
100
( 119)
Kyushu
47
53
100
( 361)
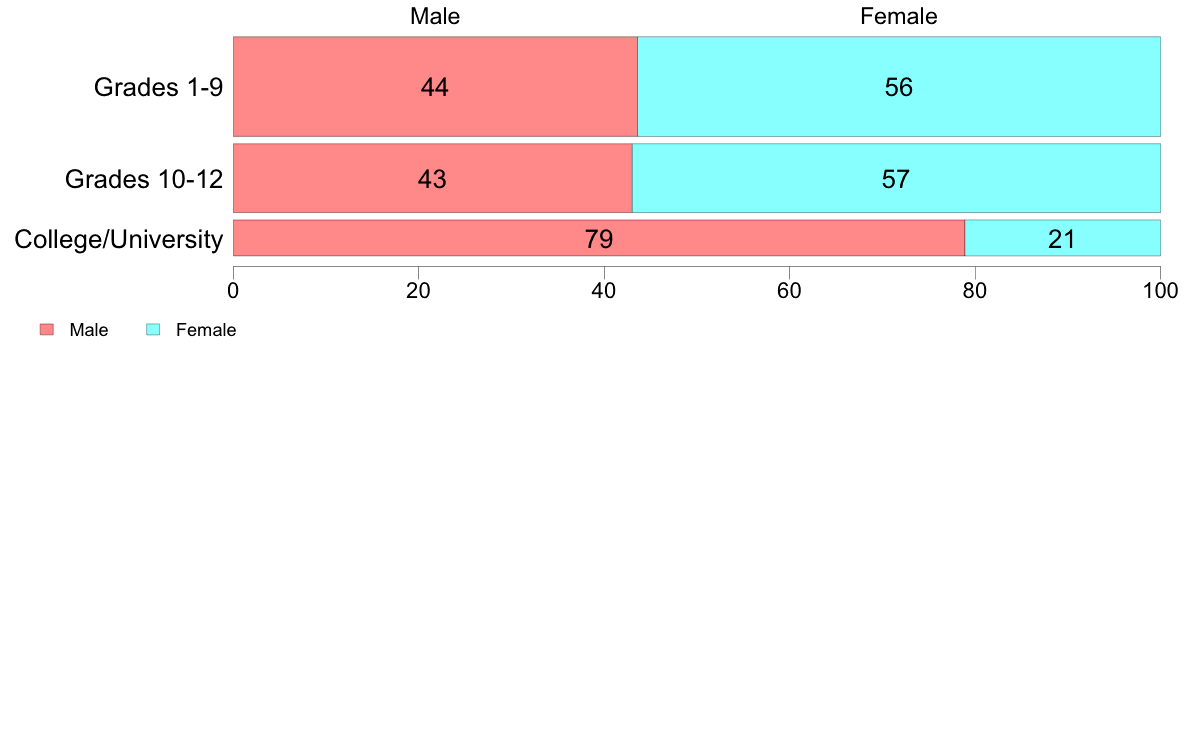
Grades 1-9
44
56
100
(1,665)
Grades 10-12
43
57
100
( 795)
College/University
79
21
100
( 218)
(C) 2017 The Institute of Statistical Mathematics