8. Other Characteristic Results
The following are other characteristic results from the results of the Thirteenth Nationwide Survey.
-
8-1. Feelings of unease towards accidents at nuclear power plants felt by 2 out of 3 individuals
Open or CloseWhen individuals were asked about their feelings of unease towards accidents at nuclear power plants, the percentage of individuals who responded that they felt 'great unease' or 'quite uneasy' was around 40% to 50% up to 2008; after the 2011 Great East Japan earthquake, however, this rose to 2 out of 3 people in 2013 (#2.30g).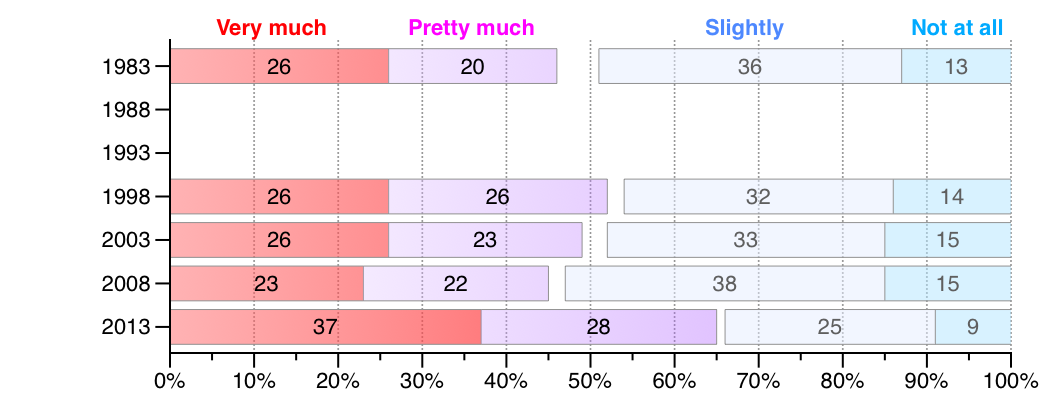
Figure 16. Unease about 'Accidents at Nuclear Power Plants'
When individuals were first asked about their feelings of unease towards natural disasters, such as earthquakes and tsunami in 2013, the percentage of people who responded they felt 'great unease' or 'quite uneasy' rose to 64% (#2.30i). This was particularly salient among women across all age groups, since 2 in 3 responded that they felt 'great unease' or 'quite uneasy.'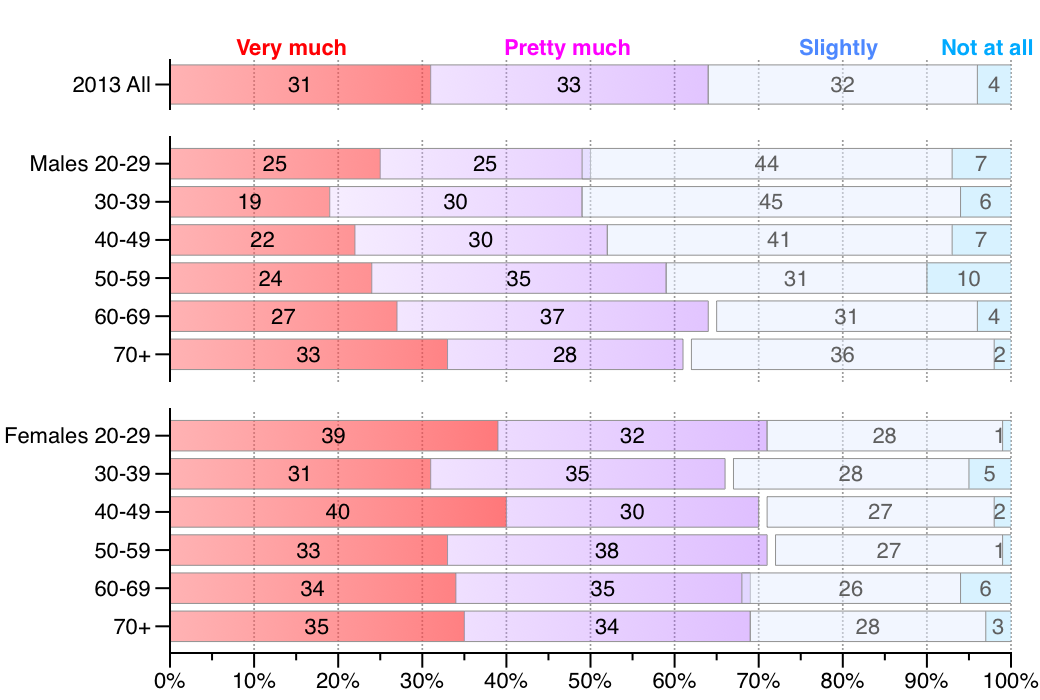
Figure 17. Unease about 'Natural Disasters like Earthquakes or Tsunami'
-
8-2. 'Family' is the most important
Open or CloseWhen asked to give any answer they wished regarding what was the most important to them, individuals who answered 'Family' numbered the largest of any previous surveys at 44% (#2.7). The next in importance were 'love/spirit' and 'life/health/myself', each being 18%. These three categories account for 80% of the total.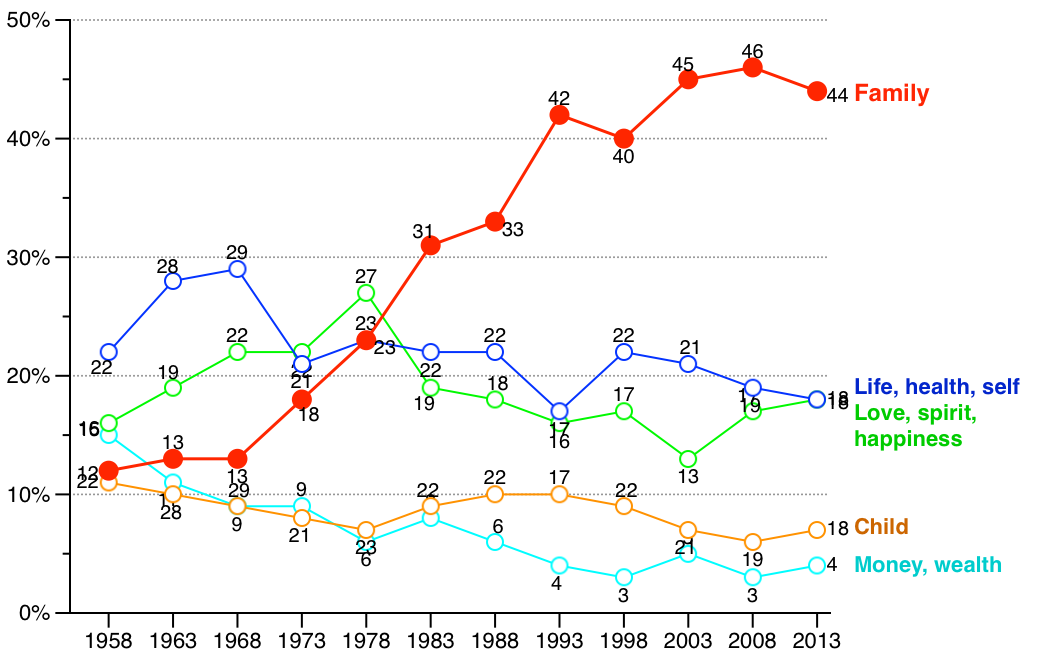
Figure 18. The Most Important Thing
-
8-3. Restoration of tradition of relations at the workplace
Open or CloseWhen individuals were asked if they thought they 'should' or 'should not' have an association with their superiors outside of work, the percentage that responded that they 'should' showed a rising trend since 2000 (#5.6*). Among individuals in their 20s and 30s in particular, this percentage returned to around 70% for 2013, the same as 1973.
When individuals were asked to choose which they would prefer to work for—'a company where the pay is high, but there are no sports days or trips for recreations' or 'a company where the pay is modest, but it has a family atmosphere with sports days and trips' —those who chose a 'company with a family atmosphere' declined from 1978 to 2003, but recent years have seen this percentage beginning to rise again (#5.6b).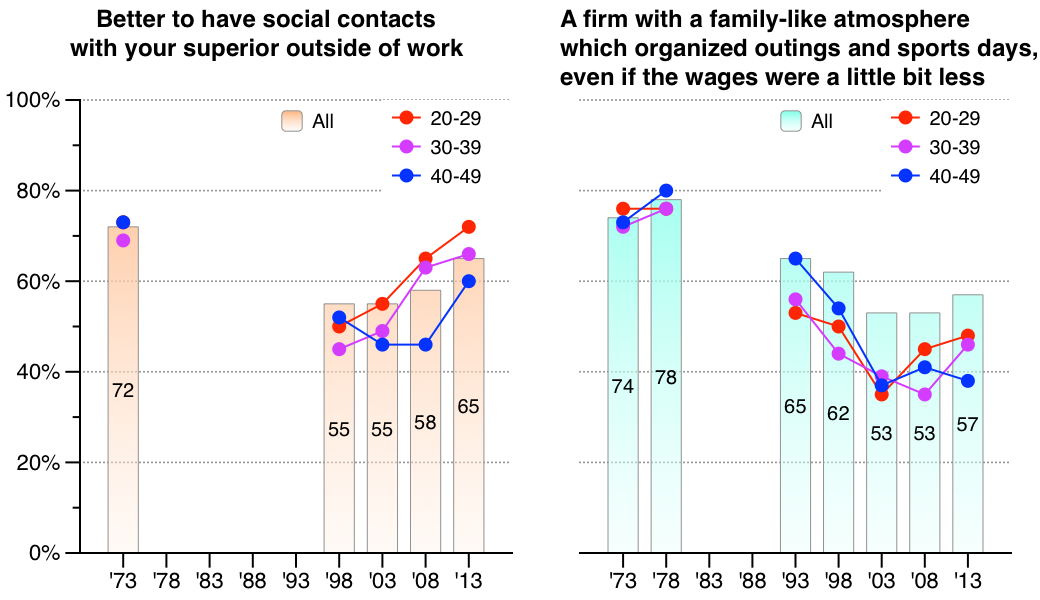
Figure 19. View of Interpersonal Relations at the Workplace
-
8-4. Increase of women who believe 'women have more fun'
Open or CloseWhen asked the question of which gender they would like to be reborn as, close to 90% of males answered that they would like to be 'reborn as a male' and 70% of females answered that they would like to be 'reborn as a female', showing no change from previous installments (#6.2).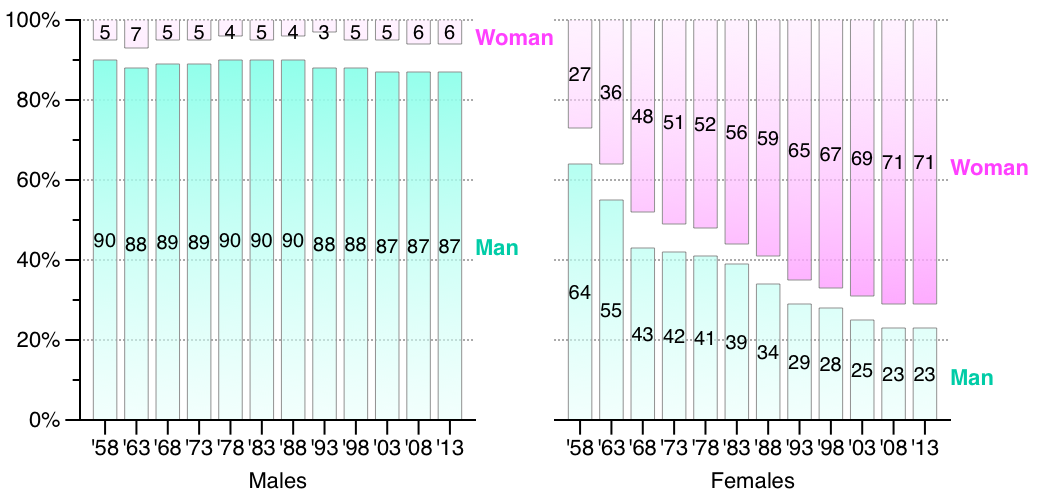
Figure 20. If you could be reborn, which gender would you like to be reborn as?
Additionally, when people were asked which gender has more 'fun,' 60-70% of both men and women responded that 'men have more fun' up to the 1970s; however, recent years have seen an increase in the responses from women who say 'women have more fun' (#6.2d).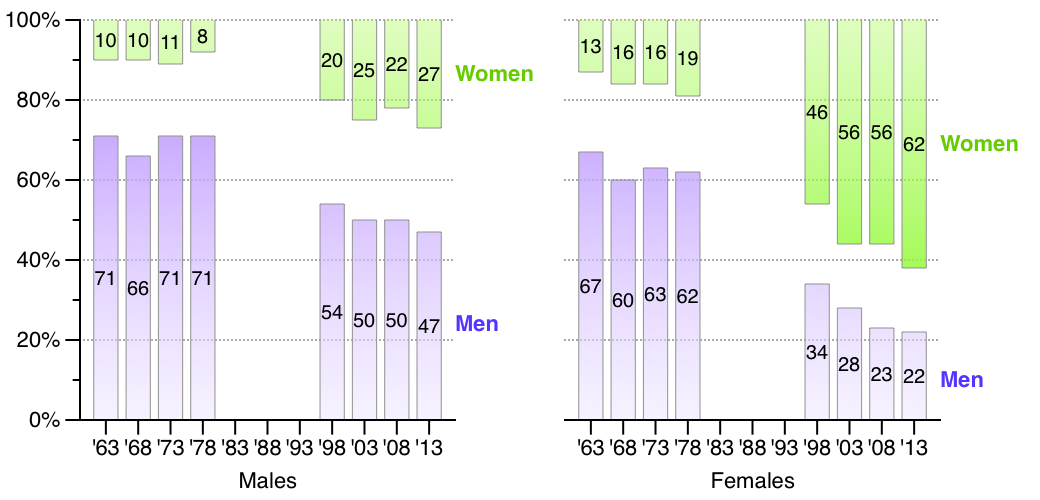
Figure 21. Who Do You Think Has More Fun? Men or Women?